What is the churn rate?
The churn rate measures the percentage of customers who leave and terminate their relationship with a company within a specified period of time.
In general, the churn rate is calculated as follows:

For example, if a company has 1,000 customers at the beginning of the quarter and 950 at the end of the quarter, the churn rate is 5%.
A high churn rate means that the company is losing an above-average number of customers, which often has a negative financial impact.
Causes of customer churn
1st cause: Dissatisfaction with the product or service
If a product or service does not meet expectations, customers often look for alternatives.
2nd cause: Pricing
Higher prices without a corresponding increase in perceived value can cause customers to churn to competitors.
3rd cause: Customer experience and service
Poor customer service, long waiting times or inadequate problem solving can significantly affect customer loyalty.
4th cause: Strong competition
Customers are often looking for the best deal and will switch if the competition offers better service or lower prices.
5th cause: Changing needs
Over time, customers’ needs may change and a particular product or service may no longer be relevant to them.
Importance of the customer churn rate for companies
The churn rate has a direct impact on a company’s profitability and growth potential.
A high customer churn rate can not only affect sales, but also damage a company’s reputation.

In addition, it is often more expensive to acquire new customers than to retain existing ones.
As a result, companies that keep their churn rate low can build more stable and profitable business models in the long term.
Strategies for reducing the churn rate
There are various methods and strategies that companies can use to minimize customer churn:
1. Strategy: Improve customer service
Resolving customer issues quickly and effectively can significantly increase loyalty.
Training customer service staff and investing in fast communication channels can help.
Strategy 2: Establish feedback systems
Regular customer surveys or other feedback mechanisms give companies insight into customer needs and satisfaction.
This allows adjustments to be made in good time.

3rd strategy: Personalized offers and services
By using data analysis and CRM systems, companies can develop personalized offers and solutions that specifically address the needs of individual customers.
4th strategy: Contract commitment and loyalty programs
Discounts for long-term subscriptions or loyalty rewards can motivate customers to stay longer.

5th Strategy: Regular product improvements
By continuously improving their products and adapting them to the changing needs of customers, companies can ensure that their offering remains relevant and attractive.
Calculate churn rate
The churn rate is calculated by measuring the percentage of lost customers out of the total number of customers at the beginning of a given period.
The basic formula for the calculation is:
Calculation example
Assume a company starts a quarter with 1,000 customers and loses 50 customers during this quarter.
- Determine the number of lost customers: 50
- Determine the total number of customers at the beginning of the period: 1,000
Used in the formula:
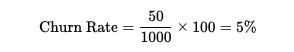
The churn rate in this case is therefore 5% for the quarter.
Calculate monthly and annual churn rate
- Monthly churn rate:
This is used to calculate customer churn on a monthly basis.
The formula remains the same; you use the monthly customer losses and the initial number of customers for the month.
- Annual churn rate:
Here you add up the customer losses over the year and refer to the total number of customers at the beginning of the year.
Calculation of the “net churn rate”
In some cases, the net churn rate is used, which also takes into account whether existing customers have increased their spending, even if other customers have churned.
The formula for this is slightly more complex and takes into account both lost customers and sales growth from existing customers:

This calculation helps companies with subscription models in particular to better understand the overall development.

Benchmarks for the churn rate
Churn rate benchmarks can vary greatly depending on the industry, business model and geographical market.
Companies should therefore know the specific requirements and standard values of their industry in order to classify their own churn rate in a meaningful way.
Here are some rough guidelines for orientation:
1st sector: SaaS (Software-as-a-Service)
- B2B SaaS (Business-to-Business):
B2B SaaS companies typically have lower churn rates, as customer contracts are often long-term.
Here, rates below 5 % per year are considered desirable, while rates above 7-8 % are considered questionable.
- B2C SaaS (Business-to-Consumer):
The churn rate is often higher for end customer-oriented SaaS companies, as private customers cancel more frequently.
Here, monthly churn rates below 5 % are considered healthy, while higher values may indicate problems.
2nd sector: Telecommunications
- Mobile phone providers:
In the mobile communications sector, churn rates vary greatly depending on the region and customer loyalty.
In saturated markets such as Europe or the USA, monthly churn rates of between 1-2 % are considered normal.
Values above 2 % often indicate intense competitive dynamics or customer satisfaction problems.

3rd sector: Banking and insurance
- Banks:
Banks generally have very low annual churn rates of less than 1 %, as customers are often tied in for the long term and there are high barriers to switching. - Insurance companies:
Annual churn rates are also often low in the insurance sector (around 2-5 %), particularly for products such as life or health insurance.
However, higher churn rates are possible for car insurance or household insurance, as customers are more likely to switch to a cheaper provider.
4th sector: streaming services and subscription models
- Streaming services (e.g. video and music streaming):
Monthly churn rates of around 5-10 % are common in this sector. Higher churn rates indicate dissatisfaction with the content or better offers from competitors. - Other subscription models (e.g. box services):
Rates vary widely depending on the type of product. Some e-commerce subscriptions have monthly churn rates of over 10%, while rates below 5% indicate strong customer loyalty.
5th sector: E-commerce and retail

- Online stores:
As many customers do not buy regularly but on demand, calculating a churn rate in e-commerce is more difficult.
For regular buyers or subscription customers, the churn rate is often between 15-30 % per year. - Subscription-based models:
For example, in the food or cosmetics sector, a monthly churn rate of 6-8 % can be considered normal.
Values below 5 % are a sign of high customer satisfaction.
6th sector: Gyms and membership models
- In the fitness industry, the annual churn rate is often 30-50 %, which is related to the typical acquisition of new customers in January (New Year’s resolutions) and the frequent termination of memberships during the year.
Studios with rates below 30 % often have effective customer retention programs.
Conclusion
The churn rate is an important indicator of the health and stability of a company.
Companies that understand the causes of customer churn and take targeted measures to reduce the churn rate have a clear competitive advantage.
By improving customer service, personalized offers and continuous innovation, companies can strengthen customer loyalty and ensure long-term growth.
Controlling the churn rate should therefore be a key objective for any company that is committed to sustainable success.
More about Customer Experience
- Everything you need to know about Customer Experience (CX)!
- Creating positive customer experiences with customer experience management
- 10 metrics to measure Customer Experience
- 3 touchpoints in the customer experience (with video)
- Your way to an effective customer experience strategy!
- 10 methods to analyze the customer experience
- 12 practical examples for improving the customer experience
- Everything you need to know about the Net Promoter Score (NPS)!
- Customer Satisfaction Score (CSAT) – Measuring Customer Satisfaction differently
- Customer Effort Score (CES): How much effort do your customers have?
- Churn Rate: Key metric for measuring customer loyalty
- The Customer Satisfaction Index (CSI): A key to measuring customer satisfaction