Create online survey with easyfeedback
Simple, modern & free to use!

• 14 interactive question types
• Integrate images, videos and sounds
• Anonymous or personalized
• Email invitations, QR code, link
• Live results
• Real-time charts and statistics
• Data export (XLS, CSV, PDF, SPSS)
• GDPR – German data protection
Create an online survey with easyfeedback
No matter how long or complex your survey should be, with easyfeedback you can create your individual online survey in just a few steps and without prior knowledge – and for free. In 6 simple steps you create a digital and interactive survey, invite your participants to the survey and receive the results in real time.
It’s that easy:
Video 1/3: Create a survey and build your questionnaire
Video 2/3: Invite participants to your survey
Video 3/3: Evaluate results of your survey
1. Log in and create a survey
Before you start, you need an easyfeedback account. If you don’t have an account yet, simply sign up here for free. On the overview page you can create your survey digitally by clicking the button “+ Create survey”.
Simply choose whether you want to start with an empty survey or use one of the free templates as the basis for your survey.

2. Add questions and content to your survey
After creating your new survey, the questionnaire editor opens. With this you can easily build and (re)design your online survey digitally and interactively according to your own ideas using drag & drop, just like in a website builder.
Create an individual welcome & closing page, create multiple pages for your survey and choose from 14 different question types (e.g. yes/no question, closed question, text fields, assessment questions, etc.). ) to find the right question. You also have the option of integrating images, video and audio files into your survey.
Once created, the questions and elements can be easily moved back and forth between pages.
If you want to have an individual course, you can work with logics, filters and jumps and direct the participants – depending on the answer – to targeted pages.

Test survey
If you want to test your questionnaire during construction, simply open the survey preview and have your construction displayed – exactly as the online survey will be presented later.
3. Design an individual layout for your survey
Once the content of the online survey is complete, you can continue with the design of a unique layout. You can use the layout configurator to customize colors, fonts, logo and images according to your taste.

4. Customize the settings of your survey
In the survey settings you can make individual adjustments:
• Single or multiple participation
• Anonymous or personalized survey
• Activate privacy policy
• Password protection and access control
• and much more
You can also activate, pause or end your survey in the settings.

5. Invite participants to your online survey
Everything ready? Then comes the most exciting part: Invite participants to your survey.
How to send your survey and invite participants:
• Send survey link independently or place on website
• Post directly to facebook, LinkedIn or twitter
• Create a QR code
• Send email invitations
• Website integration
• Generate additional links for different target groups
For example, you can easily invite your participants via a link to the survey, via our email invitation tool, or how about embedding your survey on your website? This way we offer you a very special feature to collect feedback where you need it without the help of your IT department.

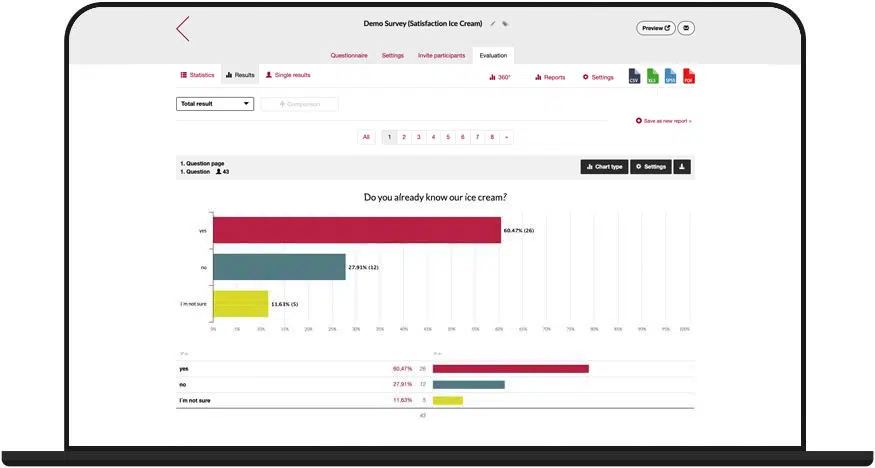
6. Evaluate and export the results of your survey
As soon as the first participant has answered the first question, you will see the result in the evaluation of your survey. The results are always displayed live and in real time. Simply switch to the survey analysis section and watch how the participants answer your online survey.
• The statistics of your survey
The statistics page shows you statistical data about the results. How many visitors, participants and dropouts your survey has. You can also find out which device was used to participate in your survey.
• The results of your survey
In the Results section, the answers are displayed in diagrams and data tables. Choose the best one for you from different chart types, adjust the colors of the charts and export them.
Using the filter settings, you can segment the results by individual participant groups and gain deeper insights into the results.
In addition, it is also possible to create comparisons. This allows you to compare individual target groups with each other and see how each target group responded.
• The individual results of the participants
The individual results show you the answers per participant. This way you can see the answers of a person as a whole.
Create your survey now for free with easyfeedback
Data protection made in Germany - create secure online surveys
When you create a survey at easyfeedback, data protection (GDPR) is automatically included. As a German company, we, easyfeedback, have chosen a data center in Germany, so that your survey data is stored in Germany without any detours.
In addition, the data center and easyfeedback are certified according to ISO27001 & TISAX in the area of IT security.
To contractually ensure the protection of your data, you can directly conclude an order processing contract in your easyfeedback account under “Account > Account data > Data protection”.