Evaluation of a customer survey
With easyfeedback, you get a professional survey tool for creating, conducting and evaluating customer surveys across the entire spectrum of customer experience.

Solutions / Customer Survey / Evaluation of a customer survey
The customer survey is followed by an evaluation of the results.
You should not begin a complete evaluation of the results until participation is complete and no more results are received.
The statistical data
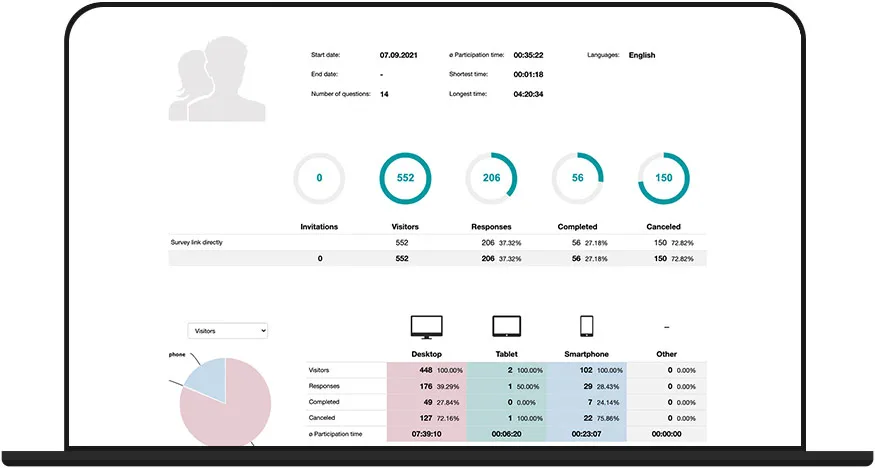
At the beginning of the analysis, you start with the statistics for your customer survey. On the statistics page, you can see how high the participation rate was.
Depending on the survey project, the ratio varies. In general, however, the connection to the author (company) is responsible for how high the participation rate is.
For customer surveys, this is inherently lower than for employee surveys.
Under the participation rate, you can see when the participations occurred.
As soon as the participation rate decreases, you might consider sending a reminder to motivate even more customers to participate.
Below that, you can see the bounce history. This shows you where customers may have dropped out and where your questionnaire is not optimally designed.
In total, you can see in the statistics how and how many customers have participated.
Detect Fake Participants
It can always happen that participants – in this case customers – want to influence the result or simply participate in order to take part in a possible lottery.
This is annoying for the result at first, but the result can be adjusted for these participants.
In order to recognize fake participants, you should first pay attention to the average response time. If this is around 15 minutes, then you have a feeling for the “real” participation time.
In the next step, export the result as an XLS file and sort based on the participation time column (from short to long). If you now discover participants who only took 1-2 minutes, you can assume that this is not real feedback.
This is because it is not possible to adequately read and answer a questionnaire in 1-2 minutes if the average took 15 minutes.
To remove the fake participants from the results, you can simply delete them from the results and clean up the result this way.
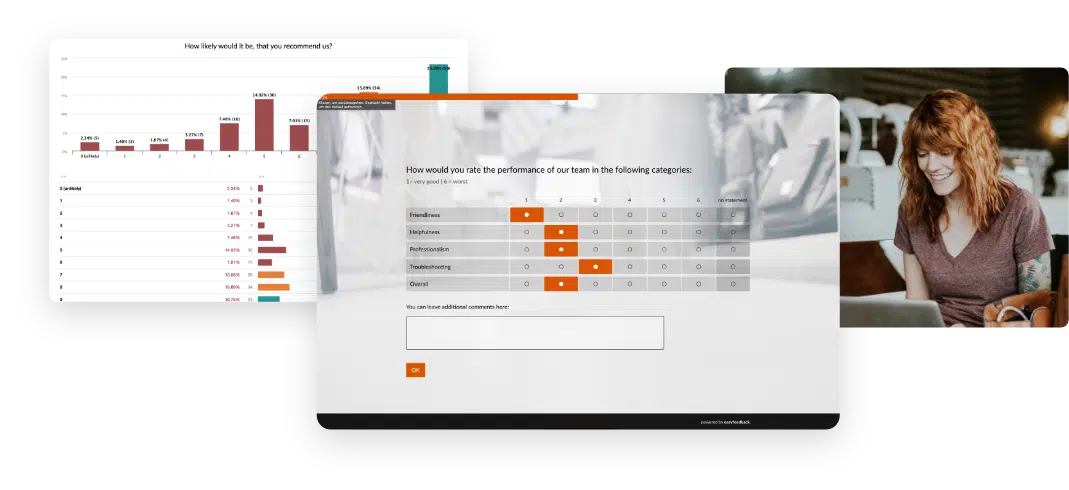
Overall result - Get an overview
Before you segment and analyze the individual participant groups, you can get an overall view. Take a look at all the results and comments.
It is helpful if you already make initial notes here if you see a particularly good or bad value. Likewise with free text answers – simply mark them.
Segmentation according to survey groups or response behavior
With the previous insight into the statistics and the overall result, you have gained an overview and can already draw initial conclusions. It gets exciting when you segment the result and analyze it more deeply. This can be done in two ways, separately or in combination:
Survey groups
If you have invited to the survey via the easyfeedback email invitation tool, you can provide additional information about each customer within the participant lists.
E.g. from which region the customer comes from, to which customer group he belongs, how much turnover the customer makes, etc.
These details are great for dividing the results into survey groups. Within the results, you simply create filters (segments) based on the data and view the result in a more differentiated way.
Response behavior
Another option is to filter the overall result based on the response behavior.
For example, you have asked your customers about satisfaction. Now you have received positive and negative feedback. The negative feedback is interesting because you can improve based on it.
To look at this further, you can create a filter (segment) based on the responses and only look at the customers who are dissatisfied.
This gives you the opportunity to identify weaknesses in the customer experience.
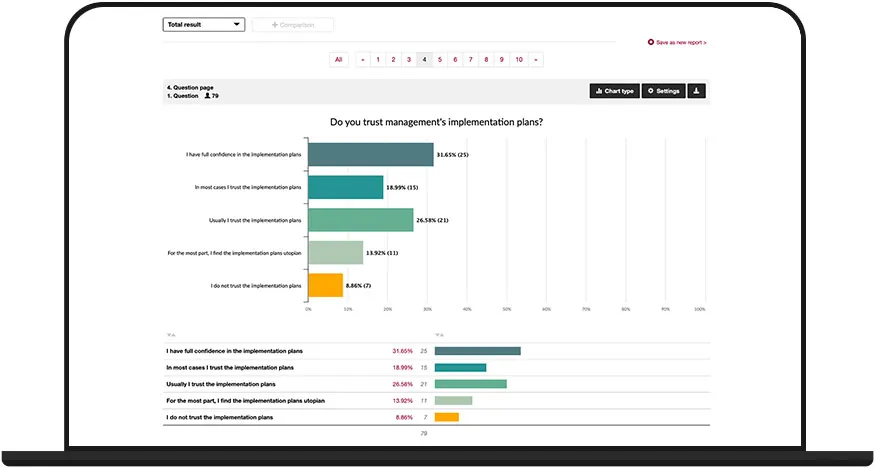
Compare result/groups
Segmenting groups of participants gives you a deeper insight.
To get a meaningful result, you should present the individual participant groups in a comparison.
The comparison shows you at a glance how the individual participant groups responded to the respective questions.
Simply place any selection of segments next to each other and display the different feedbacks.
Share result (reports)
As soon as you have finished the evaluation and segmented the prominent answers and participant groups, you can present the prepared results internally.
You should structure the presentation in such a way that the recipient can read it optimally.
For example, if you are preparing an overall report for all stakeholders, be sure to present the relevant results and statements and only go into detail when asked.
If you create a report for colleagues from your team, then it is also allowed to include more details.
In this way, you can exchange information internally about the entire feedback and discuss initial measures.
You can save multiple reports in easyfeedback. This makes it easier for you to prepare the right report depending on the recipient group and only have to hand it out.
Further information