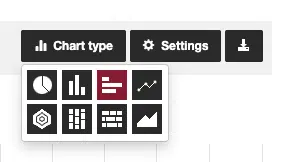
To enable you to present your results from online market research to the target group in a clear manner, we offer automatically generated tables in easyfeedback as well as different chart types for each question in your survey.
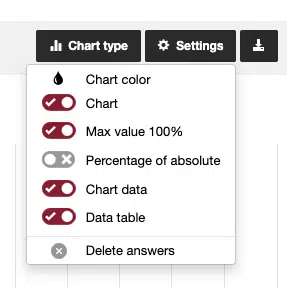
You can also configure the display of each chart type as you wish: Colors, percentage/absolute, maximum value, data view in the chart.
If you want to use the results in a presentation for PowerPoint or Keynote, for example, you can simply download the diagram of the question as an image file and include it in your presentation slides.
And if you want to further process the data with another tool such as Excel, Numbers, SPSS to create further statistical analyses, charts and tables, then you can download your market research results in easyfeedback as XLS, SPSS, CSV or also as PDF.