Easier, smarter analysis and interpretation of results - the Result STUDIO

Compare, analyze, interpret automatically – save a lot of time when evaluating your results
GDPR • ISO certified • German Server – companies that trust us


Spare yourself the external consultant - with AI analyses, your results are interpreted in minutes!
Text analysis
Various analysis functions take all the work out of preparing the free text answers. See the tenor at a glance, get an insight into the basic mood and a quintessence.
Top performance
Where are the strongest ratings? Where are the biggest deficits? Instead of searching for these manually for each participant group, they are presented to you in a summary. So you have everything at a glance.
Interpretations
Save yourself a lot of time and the external consultant and let Result STUDIO do the work for you. With the integrated interpretation of your results, all results are analyzed and presented to you in just a few minutes at the overall level or in sub-areas.
Dashboards & Analyses
Customer feedback
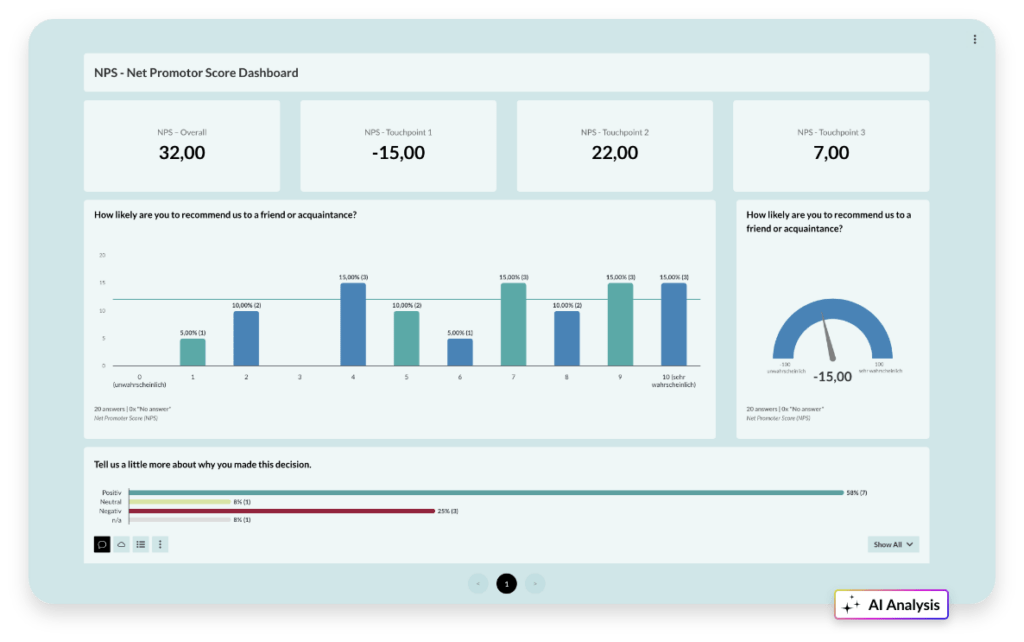
Create a dashboard from the most important KPIs, such as the NPS, and feedback from your customers and share this with the team. This way, you always have an overview of the current data.
Employee surveys
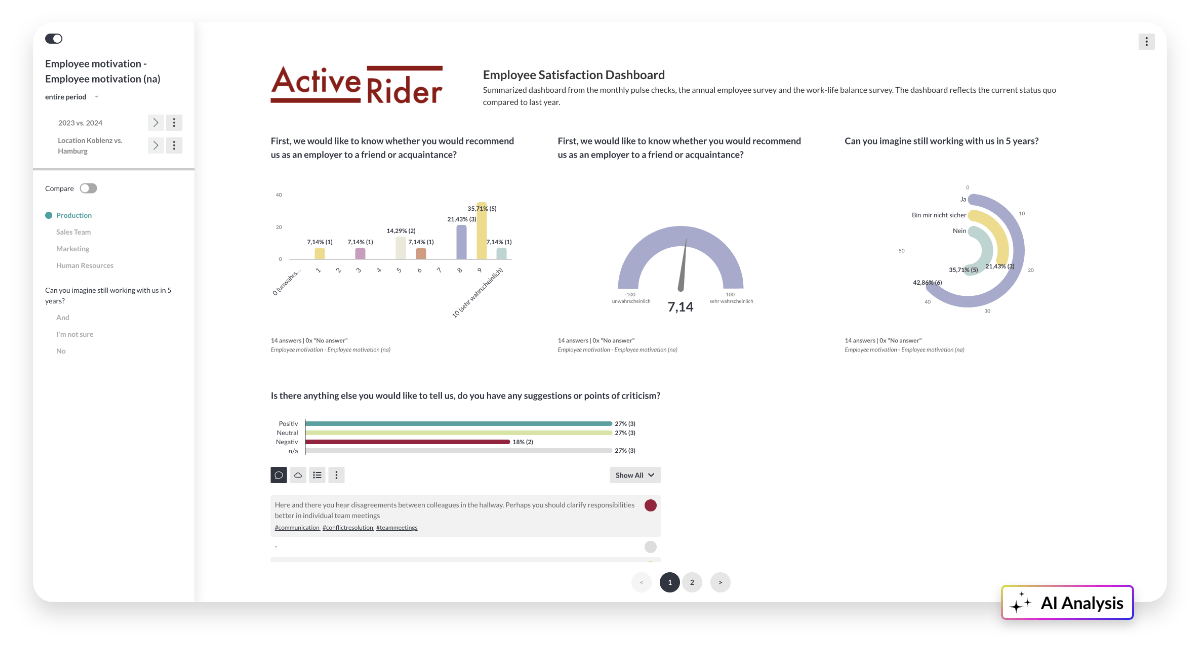
What is the feedback from individual departments? And what is the overall satisfaction level? With interactive dashboards, you can compare yourself and gain immediate insights.
360 degree feedbacks
Create 360-degree reports according to your ideas. You are the director of the data and present the results to managers – easily and comprehensibly.

What trends are emerging in your target group
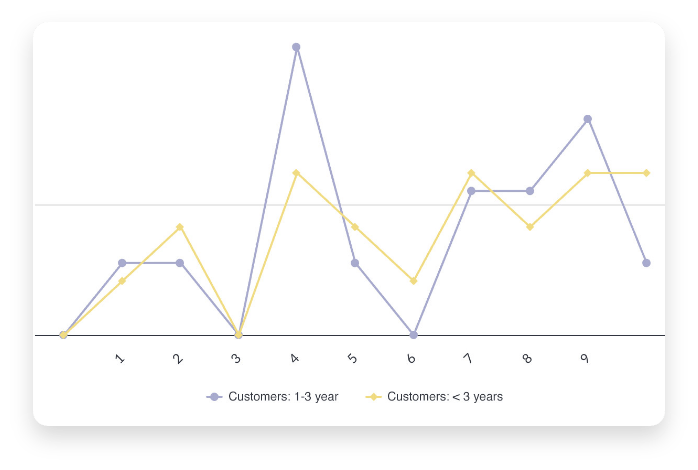
Compare target groups, entire surveys and individual questions and view trends. React to incoming situations before your competition and secure your position.

Share your insights, but only the ones you want to share
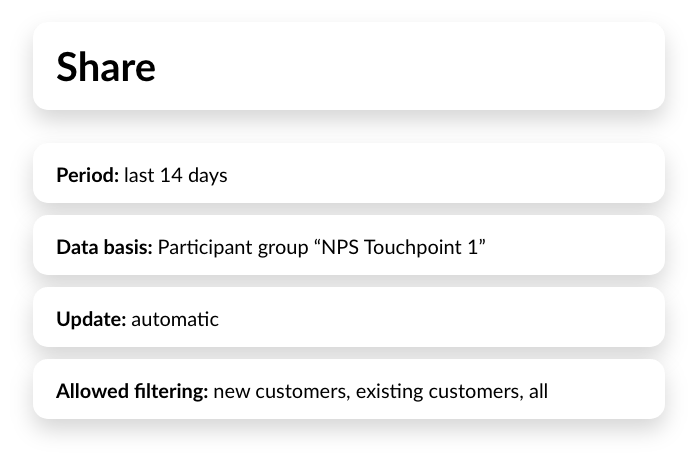
Comparison, AI analysis, last month or just a target group – you have full control and flexibility over which data you want to share with others. And if you want to share different data, simply create as many links as you need.

Your path to an easier understanding of data
Consolidate data across the board
The biggest advantage of Result STUDIO is the open interface to all your survey results. This means you don't need another tool to merge and visualize the results.
AI - Analyses
Save yourself a lot of time when evaluating the results. The AI analysis modules interpret all your results and take the work out of analyzing them.
Interactive dashboards
Your dashboard is no longer rigid, but interactive. Simply click on your individual filters and only share what you want to share.
Add your own visualizations
Instead of only accessing fixed graphics in rigid reports, you can create your own visualizations in Result STUDIO and link them to live data. This gives you completely new possibilities.
Calculate KPI values
Are you still using a calculator to calculate values? Simply use the Result STUDIO to calculate KPI values and then visualize them directly.
Comparison of entire surveys
WOW. Not only questions - but also entire and different surveys can be compared with the Result STUDIO. Simply click and discover trends.
You are in professional company


