Tip 1 – Clean up the results
You have conducted your survey and now you have the results. Now you just have to quickly summarize the answers and you can start with the implementation?
Sounds easy, but it is not recommended.
Before you present your results in a pretty diagram and communicate them to the outside world, you should first take a critical look at the results.
Yes, this is unfortunately a bit more time-consuming, since it is manual work, but the effort is worth it, trust me. But what should you look for? What are the signs of an improper response and what’s the best way to go about it?
A pretty clear sign of improper response are questionnaires that have been abandoned. Since only part of the questions have been answered, no overall picture emerges.
It may be, for example, that people who cannot provide expert information on the questions notice this and therefore abandon the questionnaire. For example, because they are not customers of your company at all.
To avoid distorting the results, you should not include the answers given in your evaluation. If a particularly large number of participants drop out of a particular question, you should revise this question for future surveys.
Another important aspect is to pay attention to your target group. Before the survey, you have defined a specific target group, for example, new customers.

The answers of people who do not correspond to your target group, in this case for example existing customers, distort your survey. Sort them out.
You should also not include questionnaires in your results that show a certain pattern of responses. For example, if answer option one was always selected for every question.
This may indicate that the questionnaire was answered by a bot (automated computer program) or by a person who only half-heartedly answered your questionnaire.
As a rule, the processing time of these questionnaires is considerably shorter, which brings us to the next tip:
Look at the average processing time of your survey.
If, for example, customers need an average of 10 minutes to complete the questionnaire, then you should critically examine all questionnaires that were completed in just a few seconds or minutes and sort them out if necessary.
What else can you look out for?
Unrealistic answers that cannot be factually correct. For example, a customer answers your question about the frequency of orders with “100 times a week”.
That seems a bit exaggerated. Often, nonsensical feedback is also recorded for open-ended questions. This ranges from incoherent letter-number combinations to statements such as “No” or similar, without the answer matching the question.
Another aspect is whether the questionnaire was answered stringently. If, for example, the customer states at the beginning of the questionnaire that he shops with you at the weekend and at the end of the questionnaire that he shops with you mainly during the week, his answers will not help you.
You should also clean up answers from these categories in order to obtain a representative survey evaluation.
Tip 2 – Pay attention to the response rate
Another important indicator is the response rate. This indicates how many results you receive in relation to the number of participants and whether your survey is representative.
The more people take part in your survey, the more meaningful the survey is.
In general, the closer the relationship between survey creator and participant, the more likely the participant will be willing to take part in the survey.
For example, the response rate is generally higher for an employee survey than for a customer survey due to the bond between the two. So here it also makes a difference whether you survey new or existing customers.
The retention rate will be proportionately higher for existing customers than for a new customer who has had little or no contact with your company.
Is the response rate significantly higher or lower than expected, also in relation to previous surveys? In this case, you should look for possible causes.
However, there are also ways to positively influence the response rate:
>> Video: Attract unmotivated participants to your survey <<
For example, it makes sense to inform your participants in advance about the survey and the goal you are pursuing. Communicate that you want to make a difference and that you will do everything in your power to solve problems afterwards.
Motivate your customers to recognize their personal benefit from the survey. A personal contact person for queries can also increase the willingness to participate.
Another important aspect is the anonymity of the participant.
Customers are generally more willing to take part in surveys if they do not have to give their name. The same applies to a reference to compliance with the General Data Protection Regulation.
In addition, it should be made as easy as possible for participants: The survey should therefore only take a few minutes, be easy to understand and mainly contain click questions.
Longer, complex issues reduce the willingness to participate and increase the dropout rate.
If all this is not enough, you also have the option of using incentives to encourage customers to take part. These can be voucher codes, discounts or competitions, for example, which customers receive as an incentive for taking part in the survey.

Tip 3 – Compare and measure
You have completed the survey. Now you have a lot of data. At first, these are unsorted and unrelated to each other.
The first thing to do is to put the data in order and get an overview. What is the distribution of parameters such as gender, age or region?
It is important to always keep the goal and purpose in mind in order to proceed as effectively and efficiently as possible.
Here, it can be helpful to combine smaller groups or units and evaluate them separately. For example, you can evaluate locations individually or view new and existing customers separately.
With easyfeedback, you have the option of setting a filter for each defined customer group so that you can compare and measure data more quickly.
>> Video: Filter and compare survey results with easyfeedback <<
After the survey is before the next survey: It makes sense to repeat surveys regularly and compare them with each other. To make these surveys comparable and to identify trends, you should not change any of the questions, if possible.
In this way, you can quickly and easily create benchmarks and evaluate the extent to which specific measures have improved customer satisfaction, for example.
In the same way, you should not let yourself be influenced by individual ratings. If you receive two worse ratings out of 30, that’s certainly not great, but as long as the majority of customers are satisfied, you shouldn’t focus on those two ratings.
Nevertheless, read between the lines and put yourself in the customer's shoes. Even from a positive review, you may still be able to draw a hint or two for improvement, which will allow you to stand out from your competition.
Tip 4 – Quantitative evaluation
Now we move on to the quantitative evaluation of the results. This means that we first restrict ourselves to the numerical evaluation of the results. The factual content of the answers will be dealt with in the next step.
In the case of closed questions, the evaluation is still relatively simple, especially if there are only two opposing answer options. How many customers voted for answer option one and how many for option two.
But even with several answer options, these can simply be compared and summed up. It becomes more difficult with a slider.
Our tip is to assign concrete values to the scale. For example, the selection option “do not agree at all” would be assigned a “0” and the selection “agree absolutely” would be assigned a “100”. The further steps could be summarized in steps of 25.
This results in the following scheme:
0 – 24
25 – 49
50
51 – 75
76 -100
do not agree at all
do not agree
neutral
tend to agree
abolutely agree
By dividing the scale in this way, you can include every result in your evaluation without presenting the evaluation too inaccurately or too superficially.
Of course, you can also use any other classification.
Calculating the average of all answers can also give you a good overview of the overall situation.
If you use easyfeedback for the creation and evaluation of your customer survey, you only have to think about the grading and you will receive an automated preparation of the scale values at the end.
For further refinement and editing, you can export the data as an Excel list.
Tip 5 – Qualitative evaluation
In addition to checking the quantitative data, the qualitative evaluation of the results also plays a major role. This is because only the qualitative data provide the detail and depth needed for a comprehensive understanding of the data and the conclusions to be drawn from it.
If you have asked open-ended questions in your questionnaire or enabled the comment function, you will learn much more than through pure click questions.
On the one hand, this gives you ideas on how to improve your products, and on the other hand, it gives you clues as to why certain results were strong or weak.
Compared to the evaluation of closed questions, the evaluation of qualitative or open questions is more demanding and time-consuming.
However, you should always take the time, because this is usually where the most valuable input of the survey is hidden and you can better understand the reasons for the respondents’ answers.
The answers to open-ended questions can be so varied that a statistical evaluation becomes very difficult. Nevertheless, we have compiled two possibilities for you:
Word cloud
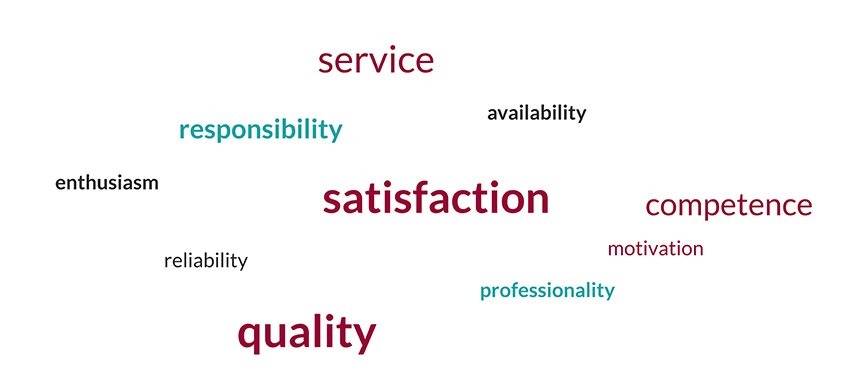
One possibility is to graphically display the answers in the form of a word cloud. In this case, frequently mentioned keywords are displayed in a larger size, which makes it possible to quickly determine the relevance of the comments.

You can create this with the help of online programs. Of course, easyfeedback also offers the function of a word cloud.
Cluster
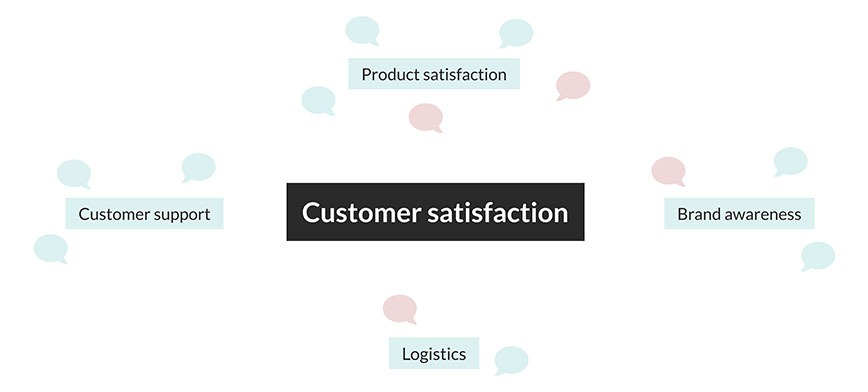
Another option is to create a kind of cluster. Here you assign the respective comments to topic areas.

Possible topics within your customer survey could be: product satisfaction, customer support, brand awareness, logistics and others.
In this way, you receive input for the relevant function in the company and can take each evaluation into account.
Tip 6 – Derive measures
>> Video: How can I derive measures from the results of a survey? <<
Have you finished evaluating your survey results? Then you can now sit back and relax?
Not quite! Because now it’s time to derive the appropriate measures. The survey of your customers has revealed potential for improvement in a number of areas. Now it’s up to you to exploit this potential.
For example, is the feel of your product not yet convincing across the board, does the service raise questions among some customers, or is your company hardly perceived on the market? Then take these findings seriously and act.
In practice, it unfortunately happens often enough that surveys are carried out, but no practical recommendations for action are derived. But this is the only way that customer surveys have a practical benefit – for you as a company and for your customers.
Only if you take your customers’ feedback seriously and follow it up with action will your survey be successful in the long term.
But positive feedback can also be helpful for your future action planning. On the one hand, it not only motivates you and your employees, but can also contain revealing information.
Here are a few more tips for deriving measures:
Every company is individual. Therefore, there is no universal rule. Make sure that the measure fits you and your company and does not conflict with company principles.
You have collected so many great ideas and would now like to implement everything immediately? Understandable, but it pays to keep a cool head.
Moreover, it doesn’t help you to open too many construction sites at the same time. You’ll quickly lose sight of what’s important. Sort your planned actions by urgency first and put the task with the greatest urgency first.
It is always better to implement one task well than many measures half-heartedly. Then implement your measures bit by bit.
Tip 7 – Presentation of the results
After you have analyzed and evaluated all results and derived appropriate measures, it is now time to prepare and present the results.
First of all, think about the stakeholders for whom you will present the results. Relevant stakeholders can be, for example, management, executives or employees of a specific department, such as customer service.
Not common in the past, now increasingly popular: Communicate evaluations to customers as well.
Customers are curious and naturally also hope for a certain improvement in their favor by participating in a survey.
It therefore makes sense to contact your customers again after the survey to tell them about the results and further steps. This ensures transparency and increases customer loyalty.
Depending on the addressee, the areas communicated may differ. For management, an all-round view is important; for customers, an indication of planned measures for specific problems may already be sufficient.
For managers, partial evaluations for the area they are responsible for can be useful. In this way, measures can be derived even more specifically.
Once the addressee for the presentation of your results has been determined, the next step is to present the data in a clear and appealing manner.
Important contents should be visible at a glance. Diagrams are a good form of presentation. Depending on the type of question, bar charts, pie charts or other diagrams are suitable.
Of course, you can make your evaluation directly via easyfeedback. Eight different diagram types and various settings are available for this purpose. Just give it a try.
>> Video: Evaluate survey results with easyfeedback <<
Conclusion
Only a conscientious evaluation of the results of your customer survey will provide you with a solid basis for deriving suitable measures.
Therefore, you should spend as much time as possible analyzing the results, because at the end of the day this will have a positive effect on your business.
After the survey is before the survey
Unfortunately, a customer survey is not enough, because you also want to know how the measures you have derived are received and whether there are other areas with hidden potential.
Regular surveys also help you to identify trends at an early stage and tailor your offering accordingly. This keeps you one step ahead of the competition and enables you to win new customers and retain existing ones.

Comparisons of different areas also help you to create a comprehensive picture of your company. In this way, you can see which areas are already running well and which areas you should focus on in order to develop further.
Another important aspect is the communication of the results to the customers. Make sure you communicate authentically at eye level. This way, your customers will see that their feedback is taken seriously and put into practice.
The resulting increase in appreciation will strengthen customer satisfaction and have a positive impact on your company.
Tips for evaluating and analyzing your employee survey can be found here.


