Evaluate results of an employee survey
With easyfeedback, you get a professional survey tool for creating, conducting and evaluating employee surveys in all areas of personel development and management.

Solutions / Employee Survey / Evaluate results of an employee survey
The employee survey is followed by an analysis of the results. A complete analysis should only begin when no more results are received, otherwise additional work may be required.
As soon as the survey is finished, you can start with the analysis.
The statistical data
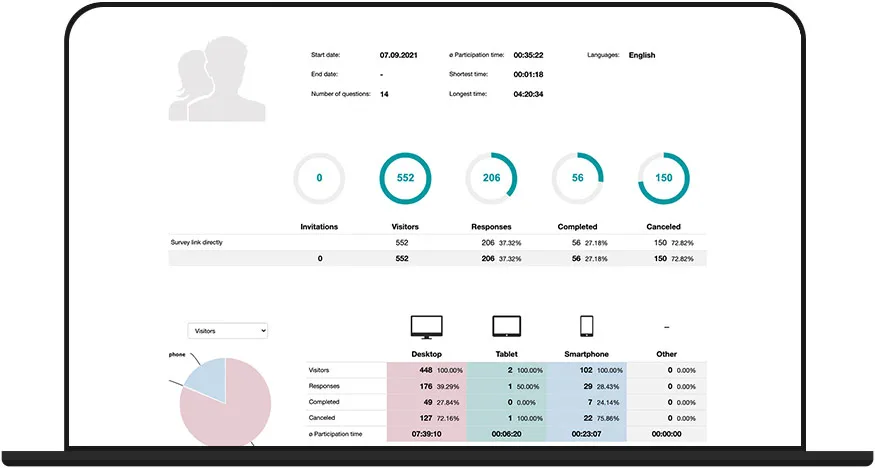
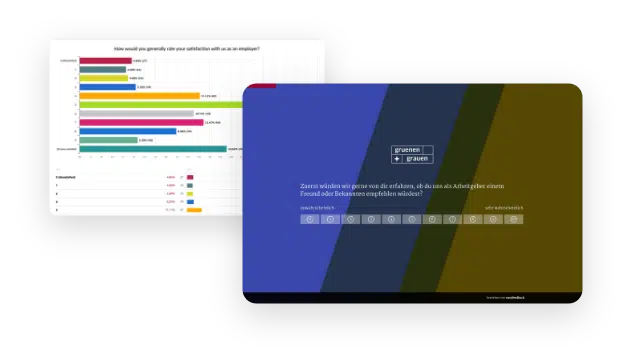
At the beginning of the analysis, you start with the statistics for your survey.
On the Statist page you can see how high the participation rate was.
Depending on the survey project, the ratio varies, which is a good participation rate.
In general, however, the bond with the author (company) is responsible for how high the participation rate is.
For employee surveys, this is inherently higher, averaging around 90 %.
If you only achieved a participation rate of 70 % in a full survey, you should check why this is the case:
- Were some of your colleagues unable to participate for time or technical reasons?
- Or could they participate but did not?
In the latter case, this is already an indication that there is no trust in the survey or even commitment to the employer.
In this case, it is even more important to find out where the problems lie between colleagues and management – but that is another topic.
Under the participation rate, you can see when the participations took place. This shows you how you could motivate colleagues to participate, for example, with a reminder.
Below that you can see the drop-off history. This shows you where an increased number of participants dropped out and where your questionnaire was not optimally designed.
In total, you can see in the statistics how the acceptance of the employee survey was.
Detect fake participants
It can always happen that participants – in this case employees – want to influence the result or simply participate in order to fulfill their target.
This is annoying for the result, but gives you an indication of the overall mood in the company and the commitment to the management.
To identify fake participants, you should first look at the average response time. If this is around 15 minutes, then you have a feel for the “real” participation time.
In the next step, export the result as an XLS file and sort the column with the required participation time (from short to long).
If you now discover participants who only took 1-2 minutes, you can assume that this is not real feedback. Because in 1-2 minutes it is not possible to read and adequately answer a questionnaire with about 10-15 questions.
To remove the fake participants from the results, you can simply delete them from the results to get a cleaned result display.
Overall result - Get an overview
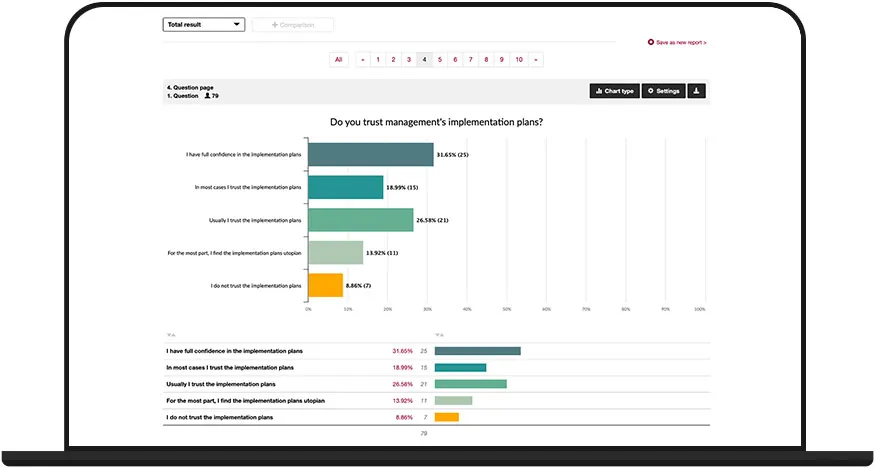
Before you segment and analyze survey groups, it is worth gaining an overall view first.
Take a look at all results and comments and make initial notes, especially if the results are conspicuously good or bad.
Also pay attention to recurring comments or opinions in free text responses – these can reveal valuable patterns and trends.
Segmentation according to survey groups or response behavior
With the previous insight into the statistics and the overall result, you have gained an overview and can already draw initial conclusions.
Now it gets exciting when you analyze the result more deeply.
You can do this in two ways – separately or in combination.
Survey groups
For example, if you asked about the satisfaction of internal communication in your employee survey, an overall result is good.
But this does not show you in which department or process communication is good or bad.
Therefore, you need to segment the result to survey groups – e.g., to individual departments, teams or project groups.
With a filter (segmentation) you only look at a part of the respondents and can furthermore see more precisely “where” in the company communication is going well or badly.
Response behavior
If you cannot or do not want to identify any survey groups, you can also segment the result according to response behavior.
Segmentation by response behavior can also be done in combination with a survey group and provides further insight.
As an example, you have again asked about the satisfaction of internal communication (grading from “poor” to “very good”).
In this case, we are interested in all answers that selected “medium” to “poor”.
With a filter setting to all those who chose medium to poor, you will only see the other answers from these participants in the course of the results.
This allows you to see if these people generally rate everything as “poor” or only in this range.
This also allows you to identify and evaluate other negative correlations.
Compare result/groups
Segmenting survey groups gives you deeper insight.
To get a meaningful result, you should compare the individual survey groups.
The comparison shows you at a glance which of the survey groups gave better or worse feedback.
To do this, simply place any selection of segments next to each other and display the differences.
Share result (reports)
Once you are done with the analysis and have segmented the salient responses and survey groups, you can present the preparation of the results internally.
The presentation of the results should be based on the recipients of the report.
For example, if you are creating an overall report for all employees, you should make sure that no names or personal identifiers have been mentioned in comment fields by the participant.
If you create a report for a department head or the management, then this report may also contain more details – in consultation with the works council and how much personal reference is permissible or not.
You can save multiple reports in easyfeedback.
This makes it easier for you to prepare and hand out the correct report depending on the recipient group.