Your survey has started and the first people have taken part. From the first answer of a participant you can see the results in the evaluation. This allows you to draw an interim conclusion at any time and evaluate the results at the end.
View results
To open the results of your survey, simply click on the tab Evaluation. Here you have access to the statistics, the answers in the form of charts and tables as well as the individual results.

Statistics
On the statistics page you can see – besides some basic data – the participation behavior of each visitor source. How many visitors and participants have taken part in your survey in total, how many have completed it and how many have dropped out.

Below this, you will see which device was used to take part in the event.

And underneath you can see the chronological course of participation: Number of participants per day.

At last you can see the jump process. It shows you on which side of your survey the participants have left the survey.

Results
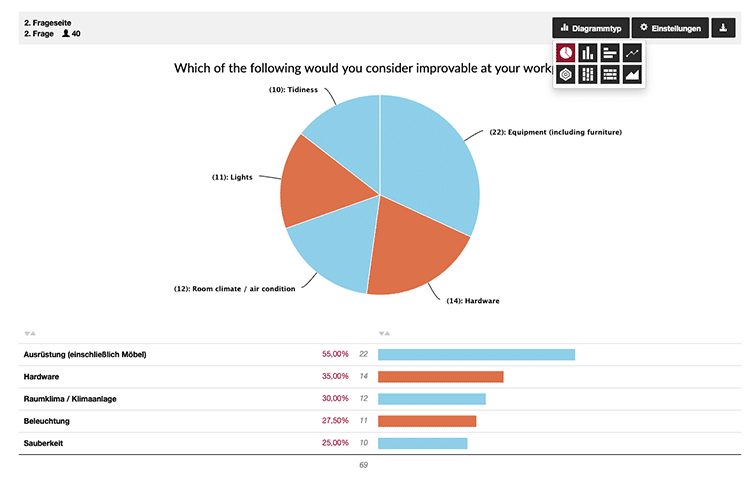
The Results tab gives you access to the total or partial results (filtered view) from your survey. At this point, the results are displayed in different charts and data tables.

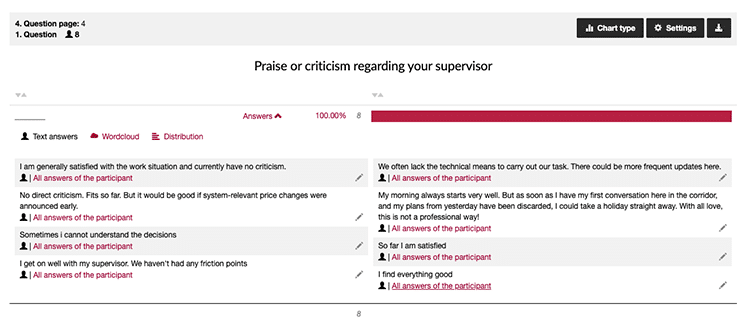
You can also view text answers here.

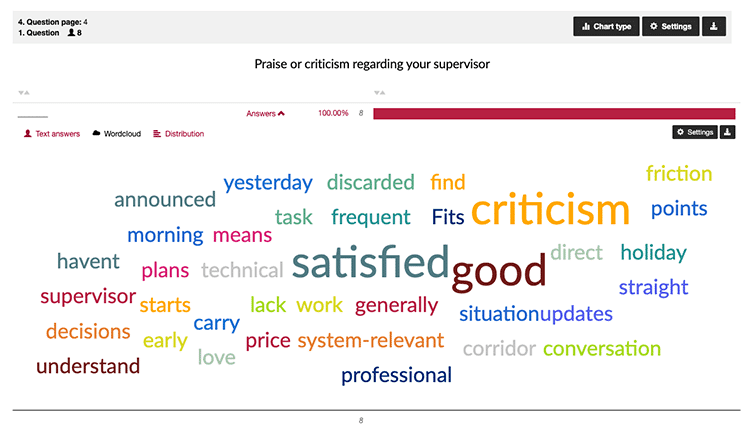
And with the word cloud, the most frequently mentioned words can be highlighted.

To export the results, simply select the desired format and download your results. Various settings allow you to export all or only partial results.

Filter & compare results
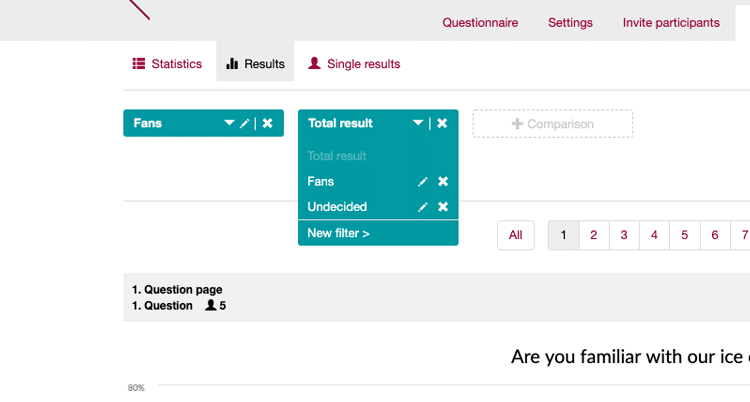
The overall result gives a good overview of the total responses. For a more in-depth analysis, you can filter the result to a sub-area, and even compare them if desired. This will give you deeper insights and allow you to make better decisions based on them.
To create a filter, click on Total result in the dropdown and select New filter >.

Now make the desired settings and save the filter. This filter is now available to you.
If you want to create a comparison within the result, click on the grey button “+ comparison” and select a second filter to compare the results.

With filters and comparisons, you can prepare the results the way you need and want to present them.

View detailed results
Under the third tab Individual results you can display the answers of each individual participant. This allows you to see at a glance how each individual participant answered.

At this point you also have the option to edit or delete individual results, or to delete all results of a survey.
