Support the thesis of your term paper with empirical research

Conduct an empirical study with a survey

With this ready-made survey template, you can quickly determine whether your target audience supports your hypothesis or whether you need to revise it - and possibly refute it — for your term paper.

Immobilienscout 24 ist begeisterter easyfeedback Nutzer

“Identifying user needs is at the heart of our business. easyfeedback has been helping us with this task for several years now. We particularly appreciate its intuitive usability and professional support.”

Franziska Becker
Guild Lead User Experience Research
TUI ist begeisterter easyfeedback Nutzer

“We use easyfeedback for internal and external surveys—it’s fast, convenient, and easy! The uncomplicated and friendly support puts a smile on our faces, and we are delighted with the continuous development of the platform.”

Jennifer Fischer
Guest & Competitor Insights Analyst

Why conduct empirical research using surveys?

Empirical theses are in high demand in both academia and the business world. They offer the opportunity to test theoretical assumptions through your own data collection.

A survey is the most direct and effective way to confirm or refute theories.

With our special offer for students, you can get started with market research quickly and easily.

Use our templates for the education sector to start creating your survey right away.

The platform allows you to create a customized survey, invite participants, and efficiently analyze the collected data.

Particularly useful is the option to find free participants for your survey on pollpool , a platform that helps you recruit a suitable sample for your research.

This saves you time and effort, allowing you to focus entirely on your analysis and the evaluation of the results.

Rely on data-driven research and take your thesis to the next level with empirical findings.

Contents of the template:

  • Usage Behavior
  • Would you use something new and unfamiliar?
  • Criteria for Use
  • Information about new offerings
  • Decision regarding intent to use
  • Demographic data

Objectives of the survey:

  • Conducting original market research for the thesis
  • Collecting basic data
  • Analyzing the data for the thesis
  • Drawing conclusions for the thesis

Helpful features for the survey:

  • Survey options: Anonymous, partially anonymous, personalized
  • Invitation options: Link, email, QR code, and more
  • Automatic email notification after the form is submitted
DSGVO-konforme Online-Umfragen

Data protection „made in Germany“ (GDPR)

Anonyme Teilnahme an Umfragen

Anonymity function for honest feedback

Frequently asked questions about empirical research

As part of university education, academic papers—also known as scholarly papers—are required to pass a course or obtain a specific academic degree, such as a Bachelor’s or Master’s degree.

These academic papers are an important component of a degree program and demonstrate that students can independently engage with academic topics.

They serve not only as a basis for assessment in the respective course, but also as an indicator of students’ ability to analyze, understand, and present complex topics in written form.

An academic paper usually includes a theoretical part, which approaches the topic primarily through literature, and a practical part, which supports or demonstrates the topic through analysis and original research.

The theoretical part often includes a literature review in which existing research, theories, and approaches related to the chosen topic are presented and discussed.

The practical part may involve various methods, such as empirical studies, case studies, surveys, or experiments, depending on the subject and academic discipline.

The quality of an academic paper depends on various factors, including the relevance of the topic, depth of analysis, quality of research methods, and clarity of presentation.

Careful planning, thorough research, and clear argumentation are crucial to the success of an academic paper.

The structure of an academic paper usually follows a clear and organized format, ensuring that the work is logically structured and includes all necessary elements.

Here is a general guide to structuring an academic paper:

1. Title page

  • Title of the paper
  • Name of the university, faculty, or institute
  • Name of the author
  • Student ID number
  • Name of the supervisor
  • Submission date


2. Table of contents

  • Overview of chapters and subchapters with page numbers.


3. List of abbreviations (optional)

  • List of abbreviations used in the paper and their meanings.


4. Introduction

  • Introduction to the topic and relevance of the research question.
  • Objectives and research questions.
  • Brief outline of the structure of the paper.


5. Theoretical background / literature review

  • Presentation of the theoretical foundations and relevant literature.
  • Definitions of key terms.
  • Overview of the current state of research.


6. Methodology

  • Description of the research design and methods.
  • Explanation of data collection procedures, such as surveys, interviews, or experiments.
  • Selection of the sample and justification.
  • Data analysis methods.


7. Results

  • Presentation of the research findings.
  • Use of tables, figures, and charts for illustration.
  • Objective presentation of data without interpretation.


8. Discussion

  • Interpretation and analysis of the results.
  • Reference to the research questions and objectives formulated in the introduction.
  • Comparison with the literature review.
  • Discussion of possible explanations, implications, and limitations of the results.


9. Conclusion and outlook

  • Summary of the key findings.
  • Answers to the research questions.
  • Outlook for future research and potential practical applications.


10. References

  • Complete list of all sources cited in the paper.
  • Use of a consistent citation style, such as APA, MLA, or Chicago.


11. Appendices (optional)

  • Supplementary materials such as questionnaires, interview guides, detailed tables, or additional figures.


12. Declaration of originality

  • Declaration that the work was completed independently and without unauthorized assistance.


Additional tips:

  • Clarity and precision: Make sure that your arguments are formulated clearly and precisely.
  • Logical structure: Ensure that the paper has a logical structure and a clear common thread.
  • Spelling and grammar: Proofreading is crucial to avoid errors.
  • Citation style: Ensure that sources are cited correctly and consistently.


This structure may vary depending on the university or specific requirements, so it is important to follow your institution’s guidelines.

Empirical research is a scientific methodology that uses methods such as surveys, interviews, experiments, measurements, or observations to support or reject findings about a subject under investigation or a proposed hypothesis.

However, empirical research is no longer used only in academic contexts.

Companies and market research institutes also use this method, for example, to find out which trends or changes are occurring in society, whether business ideas and products are well received in the market and by the target audience, or how companies are perceived.

Research data can be collected using quantitative or qualitative research methods, which differ in their data collection techniques and sample sizes.

Quantitative research methods focus on the statistical analysis of numerical data and are often used to examine relationships between variables or test hypotheses.

Examples include surveys with closed-ended questions, experimental studies with clearly defined measurements, or the analysis of sales data.

Qualitative research methods, on the other hand, aim to gain deeper insights into people’s motivations, attitudes, and behaviors.

This is often achieved through open-ended interviews, focus groups, observations, or the analysis of texts or images.

Qualitative research is particularly useful when seeking to understand complex social phenomena or generate new ideas.

The choice of appropriate research methods depends on various factors, including the research question, available resources, and the type of data being examined.

Mixed methods that combine quantitative and qualitative approaches are also often used to enable a more comprehensive understanding of the research subject.

Like all methods, empirical research has both advantages and disadvantages. These are outlined below:

Advantages

  • Generating new insights using scientific data: Empirical research is based on collecting and analyzing real-world data, leading to new and often practically relevant insights.


  • Research with a concrete practical focus: The results of empirical research often have direct practical benefits and can contribute to solving specific problems.


  • Not purely literature-based and therefore independent research: Empirical research goes beyond theoretical considerations and makes it possible to conduct independent studies and generate new data.


Disadvantages

  • Research results depend on participants’ motivation and willingness to take part: The quality and reliability of results can be influenced by participants’ willingness to participate and their level of engagement.


  • High workload and planning effort: Planning and conducting empirical studies requires careful preparation, methodological precision, and extensive resources.


  • Implementation takes time: From data collection to analysis, the research process can be time-consuming, which may delay the implementation and publication of findings.

The process of empirical research involves several systematic steps that ensure the study is thorough and scientifically sound.

Here are the typical phases of the research process:

1. Phase: Topic selection and research question

  • Selecting a relevant and interesting topic.
  • Formulating a clear and precise research question or hypothesis.


2. Phase: Literature review

  • Reviewing existing academic work on the topic.
  • Identifying research gaps and theoretical foundations.


3. Phase: Research design and methodology

  • Deciding on the appropriate research method, such as surveys, experiments, or observations.
  • Defining the research design—qualitative, quantitative, or mixed methods.
  • Selecting the sample and determining the sample size.


4. Phase: Data collection

  • Conducting the selected methods for collecting data, such as distributing questionnaires, conducting interviews, or carrying out experiments.
  • Ensuring compliance with ethical guidelines and data protection requirements.


5. Phase: Data preparation and analysis

  • Preparing the collected data, such as cleaning data and coding responses.
  • Analyzing the data using appropriate statistical or qualitative methods.


6. Phase: Interpretation of results

  • Interpreting the analyzed data in the context of the research question.
  • Comparing the results with the theoretical foundations and existing studies.


7. Phase: Conclusions and implications

  • Drawing conclusions from the results.
  • Discussing practical implications and possible applications of the research findings.
  • Making suggestions for further research and potential improvements.


8. Phase: Reporting and publication

  • Preparing a detailed research report or academic publication.
  • Presenting the results in academic or public forums.
  • Submitting the work for publication in academic journals or at conferences.


9. Phase: Evaluation and reflection

  • Reflecting on the entire research process and the methodological approaches used.
  • Assessing the strengths and weaknesses of the study conducted.
  • Identifying potential improvements for future research projects.

Quality criteria are essential for assessing the quality and credibility of empirical research. They cover various aspects that ensure research is robust, reliable, and valid.

Here are the most important quality criteria:

1. Criterion: Objectivity

Objectivity means that research results are independent of the individuals conducting the research.

There are different forms of objectivity:

  • Objectivity of administration: Data collection should always lead to the same results, regardless of the researcher.
  • Objectivity of evaluation: Data analysis should always lead to the same results, regardless of the researcher.
  • Objectivity of interpretation: The interpretation of results should always be the same, regardless of the researcher.


Ensuring objectivity:

  • Standardized procedures for data collection and analysis.
  • Clear and unambiguous instructions for conducting the research.


2. Criterion: Reliability

Reliability refers to the dependability and consistency of measurement results. A measurement instrument is reliable if it produces the same results when used repeatedly under the same conditions.

Ensuring reliability:

  • Test-retest reliability: Checking the consistency of results through repeated measurement.
  • Inter-rater reliability: Consistency of results across different observers or raters.
  • Internal consistency: Checking the consistency of results within a test, for example using Cronbach’s alpha.


3. Criterion: Validity

Validity refers to whether a measurement instrument actually measures what it claims to measure. There are different forms of validity:

  • Content validity: The measurement instrument covers all relevant aspects of the construct.
  • Criterion validity: The measurement results correspond with other valid measurements, for example through comparison with a gold standard.
  • Construct validity: The measurement instrument actually measures the theoretical construct it is intended to measure, for example through factor analysis.


Ensuring validity:

  • Theoretical foundation and definition of the constructs to be measured.
  • Checking validity by comparing results with other established measurement instruments.


4. Criterion: Representativeness

Representativeness means that the sample reflects the target population as accurately as possible, so that results can be generalized to the entire population.

Ensuring representativeness:

  • Using appropriate sampling methods, such as random samples.
  • Ensuring a sufficient sample size to support the generalizability of results.


5. Criterion: Transparency

Transparency means that the research process and methods used are documented openly and in a traceable manner.

Ensuring transparency:

  • Detailed description of the methodology, data collection, and analysis.
  • Disclosure of all relevant data and procedures.


6. Criterion: Ethics

Ethics refers to compliance with ethical standards and guidelines throughout the research process.

Ensuring ethical conduct:

  • Obtaining informed consent from participants.
  • Protecting privacy and data confidentiality.
  • Avoiding harm to participants and treating everyone involved fairly.


7. Criterion: Applicability (practical relevance)

Applicability means that research findings are relevant and useful in practice.

Ensuring applicability:

  • Focusing on research questions that are relevant to practice.
  • Considering the implications and practical applicability of research findings.

Empirical research includes various methods for data collection and analysis, which can be used differently depending on the research question and context.

Here are the most important methods of empirical research:

1. Method: Quantitative

Quantitative methods focus on collecting and analyzing numerical data. They are particularly useful for testing hypotheses and obtaining generalizable results.

a. Surveys and questionnaires

  • Description: Standardized data collection instruments that can reach a large sample.
  • Advantages: Cost-effective, easy to analyze, and suitable for statistical evaluation.
  • Disadvantages: Possible bias due to self-reporting and limited depth of responses.


b. Experiments

  • Description: Controlled studies in which one or more independent variables are manipulated to measure their effect on dependent variables.
  • Advantages: High control over confounding variables; causal relationships can be identified.
  • Disadvantages: Artificial setting; external validity may be limited.


c. Secondary data analysis

  • Description: Analysis of existing data, such as statistics, archives, or databases.
  • Advantages: Cost-effective and provides access to extensive data sets.
  • Disadvantages: Limited control over data quality and structure, as well as possible issues with data relevance.


2. Method: Qualitative

a. Interviews

  • Description: In-depth conversations with participants that provide insights into their attitudes, opinions, and experiences.
  • Advantages: Rich and detailed data; flexible and adaptable method.
  • Disadvantages: Time-consuming; analysis may be complex and subjective.


b. Observations

  • Description: Systematic recording of behaviors and events in their natural context.
  • Advantages: Direct recording of behavior and a high degree of real-world relevance.
  • Disadvantages: Observer effect, time-consuming, and limited generalizability.


c. Case studies

  • Description: Detailed examination of a single case or a small number of cases.
  • Advantages: Deep insight into complex phenomena and contextualization of results.
  • Disadvantages: Limited generalizability and potential subjectivity.


d. Focus groups

  • Description: Group discussions on a specific topic, moderated by a researcher.
  • Advantages: Interactive and dynamic data, with the opportunity to capture different perspectives.
  • Disadvantages: Group dynamics can influence results; analysis can be complex.


3. Method: Mixed methods

Mixed methods combine quantitative and qualitative approaches to use the strengths of both methods and achieve more comprehensive results.

a. Convergent parallel designs

  • Description: Quantitative and qualitative data are collected simultaneously and analyzed independently, then compared and integrated.
  • Advantages: Provides a complete picture of the research question and validates results through triangulation.
  • Disadvantages: Requires extensive resources and expertise in both methods.


b. Sequential designs

  • Description: One method is used first, and its results influence how the second method is conducted, for example a qualitative preliminary study used to develop a quantitative instrument.
  • Advantages: Methods can build on one another; flexible and adaptable.
  • Disadvantages: Time-consuming and requires careful planning and coordination.

Qualitative and quantitative research are two fundamental methods in academic research that differ in their approach, objectives, and methods.

Here are the main differences and characteristics of both approaches:

Qualitative research

Objective:

  • Understanding phenomena, experiences, and meanings.
  • Exploring the depth and detail of complex relationships.


Methods:

  • Interviews, such as in-depth, semi-structured, or unstructured interviews
  • Focus groups
  • Observations, either participant or non-participant
  • Content analysis, such as the analysis of texts, images, or videos
  • Case studies


Data types:

  • Non-numerical data such as texts, images, videos, and audio recordings.


Analysis:

  • Thematic analysis
  • Discourse analysis
  • Grounded theory
  • Narrative analysis


Advantages:

  • Deep understanding of subjective experiences and social processes.
  • Flexibility in the research process.
  • Can generate new hypotheses and theories.


Disadvantages:

  • Results are often not generalizable.
  • Time-consuming and resource-intensive.
  • Subjectivity can influence the results.


Quantitative research

Objective:

  • Measuring and analyzing variables.
  • Determining relationships, patterns, and correlations between variables.
  • Obtaining generalizable results through statistical analysis.


Methods:

  • Surveys and questionnaires
  • Experiments
  • Secondary data analysis
  • Statistical models and simulations


Data types:

  • Numerical data that can be quantified, such as numbers and scale values.


Analysis:

  • Descriptive statistics, such as mean, median, and standard deviation
  • Inferential statistics, such as t-tests, ANOVA, and regression
  • Hypothesis testing


Advantages:

  • Results are often generalizable.
  • Objectivity through standardized methods.
  • Ability to analyze large amounts of data.


Disadvantages:

  • May not always capture the depth and complexity of social phenomena.
  • May overlook contextual factors.
  • Dependence on the quality and availability of data.


Combining both approaches

Sometimes, a mixed-methods approach is used, integrating both qualitative and quantitative methods to leverage the advantages of each approach.

This can lead to a more comprehensive analysis and deeper understanding.

Application in practice

  • Qualitative research: Often used in the humanities and social sciences, such as sociology, anthropology, and psychology, to gain deeper insights into human behavior and social processes.
  • Quantitative research: Widely used in the natural and engineering sciences as well as in business to test hypotheses and identify general patterns.

Measurement instruments in empirical research are tools used to collect data.

These instruments play a central role in gathering accurate and reliable information and adequately answering research questions.

The selection and design of measurement instruments depend on the type of research and the specific requirements of the study.

Here are some of the most common measurement instruments in empirical research:

1. Instrument: Questionnaires

Questionnaires are standardized instruments containing a series of questions used to collect information.

They can be provided on paper or electronically.

Types:

  • Closed-ended questions: Questions with predefined answer options, such as yes/no or multiple choice.
  • Open-ended questions: Questions that allow respondents to formulate their own answers.
  • Scale questions: Questions for which responses are given on a scale, such as a Likert scale.


Advantages:

  • Cost-effective, especially for large samples.
  • Easy to analyze, particularly in the case of closed-ended questions.


Disadvantages:

  • Limited depth of responses, particularly with closed-ended questions.
  • Risk of misunderstandings in the questions.


2. Instrument: Interviews

Interviews are direct conversations between the researcher and participants. They can be structured, semi-structured, or unstructured.

Types:

  • Structured interviews: Fixed questions and answer options; high comparability of responses.
  • Semi-structured interviews: An interview guide with open-ended questions; flexibility to explore new topics.
  • Unstructured interviews: Open conversations without a fixed guide; deep insights but less comparability.


Advantages:

  • Enable deeper insights and detailed information.
  • Flexible and adaptable during the conversation.


Disadvantages:

  • Time-consuming and resource-intensive.
  • Potential interviewer subjectivity may influence results.


3. Instrument: Observation protocols

Observation protocols are used to systematically record behavior or events in their natural environment.

Types:

  • Participant observation: The researcher is actively integrated into the environment and interacts with participants.
  • Non-participant observation: The researcher observes participants from a distance without intervening directly.


Advantages:

  • Captures behaviors in their natural context.
  • No bias resulting from questioning.


Disadvantages:

  • The observer effect may influence participants’ behavior.
  • Time-consuming and may raise ethical concerns.


4. Instrument: Tests and scales

Tests and scales are standardized instruments for measuring specific characteristics or abilities, such as intelligence, personality, or psychological states.

Types:

  • Psychometric tests: Tests for measuring intelligence, personality, or specific abilities.
  • Scales: Instruments for measuring attitudes, opinions, or behaviors, such as a Likert scale.


Advantages:

  • Precise measurement of specific constructs.
  • Comparability and standardization of results.


Disadvantages:

  • May contain cultural or linguistic bias.
  • Complex design and validation are required.


5. Instrument: Document analysis

Document analysis involves the systematic examination of written or digital documents, such as reports, minutes, emails, or diaries.

Types:

  • Content analysis: Analysis of document content to identify patterns and themes.
  • Discourse analysis: Examination of the language and structure of texts to understand meanings and social contexts.


Advantages:

  • Access to historical or unaltered data.
  • No influence by researchers during data collection.


Disadvantages:

  • Documents may be incomplete or biased.
  • Contextualizing documents can be difficult.


6. Instrument: Experiments

Experiments are methodological studies in which one or more independent variables are manipulated to examine their effect on dependent variables.

Types:

  • Laboratory experiments: Conducted under controlled conditions in a laboratory.
  • Field experiments: Conducted in natural settings to achieve more realistic results.


Advantages:

  • Control over confounding variables.
  • Ability to examine causal relationships.


Disadvantages:

  • An artificial setting may impair external validity.
  • Ethical concerns when manipulating variables.


7. Instrument: Technological measurement instruments

Technological measurement instruments are modern tools and devices that use technology to collect and process data. These instruments are often used in empirical research to gather precise and objective data.

Examples:

  • Sensors and measuring devices: Used to collect physical data, such as heart rate monitors or GPS.
  • Apps and online platforms: Used to collect and analyze behavioral data, such as fitness apps or online surveys.


Advantages:

  • Enable the collection of objective and continuous data.
  • Often enable automated data collection and analysis.


Disadvantages:

  • Technical issues or malfunctions may occur.
  • Data protection and security concerns.

Empirical research and statistics are closely connected, as statistical methods play a key role in analyzing and interpreting data from empirical studies.

Here is an overview of how they work together:

1. Data preparation

  • Data cleaning: Removing errors and incomplete entries from the collected data.
  • Coding: Converting qualitative data into numerical formats for statistical analysis.


2. Descriptive statistics

  • Central tendency: Calculating the mean, median, and mode to determine typical values in the data.
  • Dispersion: Determining variance, standard deviation, and range to understand data variability.
  • Visualization: Using charts, such as histograms and box plots, to illustrate data patterns and distributions.


3. Inferential statistics

  • Hypothesis testing: Conducting statistical tests, such as t-tests or chi-square tests, to test hypotheses.
  • Confidence intervals: Estimating the range within which true population parameters lie with a certain probability.
  • Regression analysis: Examining relationships between variables and predicting outcomes.


4. Multivariate statistics

  • Factor analysis: Identifying underlying factors that explain variability in the data.
  • Cluster analysis: Grouping data points into clusters with similar characteristics.
  • Analysis of variance (ANOVA, MANOVA): Comparing means across multiple groups to identify differences.


5. Data interpretation

  • Interpreting results: Interpreting statistical results in the context of the research question.
  • Identifying relationships: Identifying and explaining relationships and patterns in the data.
  • Generalization: Drawing conclusions beyond the sample in order to make statements about the entire population.

More educational survey ​templates

Student feedback questionaire template

Student Feedback

Survey template details

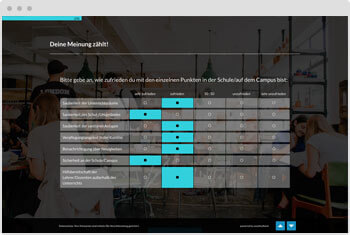
Survey template: Student Satisfaction

Student Satisfaction

Survey template details

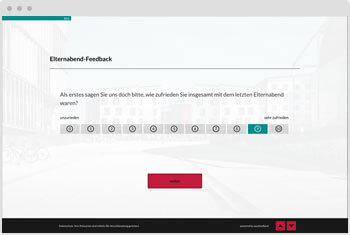
Survey Template: Parent Evening Feedback

Parents Evening Feedback

Survey template details

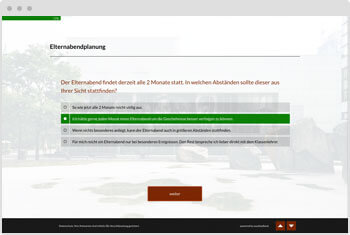
Survey Template: Parent Evening Planning

Parents Evening Planning

Survey template details

Survey Template: Teacher Evaluation

Teacher Evaluation

Survey template details

Explore all survey templates  

You are in professional company

Immoscout 24 Logo
Tui Logo
Porsche Logo
Lufthansa Logo
Jaegermeister Logo

Over 740,000 participants in easyfeedback surveys every month

Result

STUDIO

The performance add-on for your analysis

easyfeedback Result Studio 2