
How can you improve the customer experience? Find out with the NPS.

Measure your Net Promoter Score with Our Questionnaire

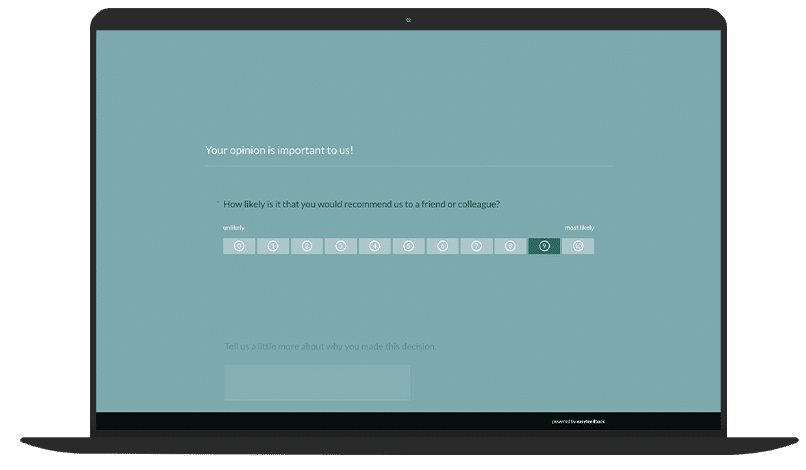
With this ready-made survey template, you can measure the Net Promoter Score® (NPS), gain valuable insights, and develop targeted strategies to increase customer satisfaction and loyalty.

Immobilienscout 24 ist begeisterter easyfeedback Nutzer

“Identifying user needs is at the heart of our business. easyfeedback has been helping us with this task for several years now. We particularly appreciate its intuitive usability and professional support.”

Franziska Becker
Guild Lead User Experience Research
TUI ist begeisterter easyfeedback Nutzer

“We use easyfeedback for internal and external surveys—it’s fast, convenient, and easy! The uncomplicated and friendly support puts a smile on our faces, and we are delighted with the continuous development of the platform.”

Jennifer Fischer
Guest & Competitor Insights Analyst

Why conduct an NPS survey?

To effectively strengthen customer loyalty, you need to understand what drives your customers’ purchasing decisions and what expectations they have of your products and services.

A precise customer survey provides you with valuable insights that enable you to make proactive improvements and satisfy your customers.

And the best part? Satisfied customers come back!

Not only do they open up more cross-selling opportunities for you, but they’re also happy to recommend your business to others.

You can gain these insights through the Net Promoter Score® (NPS).

The NPS is the world’s most widely used method for measuring customer loyalty and an internationally recognized metric that allows you to easily position yourself relative to your competitors.

Use easyfeedback as your Net Promoter Score tool and effectively boost customer satisfaction and loyalty with our questionnaire template.

Contents of the template:

Objectives of the survey:

  • Prevent customer churn
  • Win back dissatisfied customers
  • Enhance the customer experience
  • Gain brand advocates
  • Increase revenue and growth

Helpful features for the survey:

  • Survey options: Anonymous, partially anonymous, personalized
  • Invitation options: Link, email, QR code, and more
  • Segment analysis based on survey groups or response patterns
  • AI analysis of results, including recommendations for action
DSGVO-konforme Online-Umfragen

Data protection „made in Germany“ (GDPR)

Anonyme Teilnahme an Umfragen

Anonymity function for honest feedback

Frequently asked questions about the NPS

The Net Promoter Score (NPS) is a metric used to measure customer satisfaction and customer loyalty.

The NPS is based on the question:

“How likely are you to recommend our company/product/service to a friend or colleague?”

Customers answer on a scale from 0 to 10, where 0 means “not at all likely” and 10 means “extremely likely.”

The responses are divided into three categories:

  • Promoters (Score 9-10):
    These customers are highly satisfied and are likely to recommend the company. They contribute positively to word-of-mouth and promote business growth.


  • Passives (Score 7-8):
    These customers are satisfied but not enthusiastic. They are susceptible to switching to a competitor, but are not actively dissatisfied.


  • Detractors (Score 0-6):
    These customers are dissatisfied and may leave negative reviews about the company. They can potentially have a negative impact on the company’s image.


The NPS is calculated by subtracting the percentage of Detractors from the percentage of Promoters:

NPS = % Promoters – % Detractors

The NPS can theoretically range from -100 (if every customer is a Detractor) to +100 (if every customer is a Promoter).

A positive NPS (above 0) is generally considered good, while a score above 50 is considered excellent.

The NPS is often used because it provides a simple and quick way to measure customer satisfaction and loyalty, and because it is directly linked to a company’s growth potential.

There are several alternatives to the Net Promoter Score (NPS) for measuring customer satisfaction and loyalty.

Here are some of the most common alternatives:

1. Alternative: Customer Satisfaction Score (CSAT)

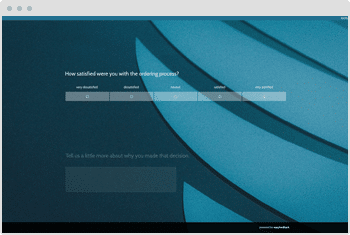
  • Description: CSAT measures customer satisfaction with a specific product, service, or interaction.
  • Question: “How satisfied are you with your experience today?” Answers are typically given on a scale from 1 to 5 or 1 to 7.
  • Calculation: Percentage of customers who gave a positive rating (e.g., 4 or 5).


2. Alternative: Customer Effort Score (CES)

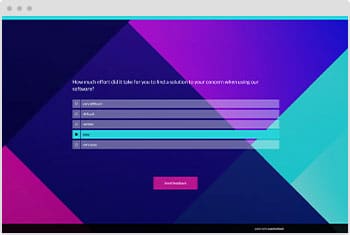
  • Description: CES evaluates how much effort customers have to make to complete a request or resolve a problem.
  • Question: “How easy was it to resolve your problem today?” Answers are given on a scale ranging from “Very easy” to “Very difficult.”
  • Calculation: Average score or percentage of customers who rate the process as “easy.”


3. Alternative: Churn Rate

  • Description: The churn rate measures the percentage of customers who leave a company during a specific period.
  • Calculation: Number of lost customers divided by the total number of customers at the beginning of the period.


4. Alternative: Customer Lifetime Value (CLV)

  • Description: CLV estimates the total value a customer generates over the entire business relationship.
  • Calculation: Average order value × purchase frequency × average customer lifetime.


5. Alternative: Customer Retention Rate

  • Description: Measures the percentage of customers who remain with a company over a specific period.
  • Calculation: (Number of customers at the end of the period – number of new customers acquired during the period) / number of customers at the beginning of the period.


6. Alternative: Customer Loyalty Index (CLI)

  • Description: Measures customer loyalty by combining questions about repurchase intention, willingness to recommend, and overall experience.
  • Calculation: Average score from the answers to several questions assessing customer loyalty.


7. Alternative: Product/Service Usage Metrics

  • Description: Analyzes how often and to what extent customers use a product or service.
  • Calculation: Usage data such as login frequency, time spent, or number of completed actions.

The Net Promoter Score (NPS) offers several advantages that make it a popular metric for measuring customer satisfaction and loyalty.

Here are some of the main advantages:

1. Advantage: Easy to Measure and Calculate

  • The NPS is based on a single, easy-to-understand question, which simplifies data collection.
  • The calculation is straightforward and can be performed quickly without complex mathematical models.


2. Advantage: High Comparability

  • The NPS is standardized across industries and enables companies to compare themselves with other companies both within and outside their industry (benchmarking).
  • It provides a consistent metric that allows companies to track their performance over time and benchmark it against competitors.


3. Advantage: Customer Loyalty and Growth Potential

  • The NPS is strongly correlated with customer loyalty and a company’s growth potential.
  • Promoters who give a high NPS score tend to be more loyal and contribute positively to business growth through word-of-mouth recommendations.


4. Advantage: Actionable Insights

  • The NPS helps companies quickly identify whether customers have a positive or negative attitude.
  • It enables companies to identify and specifically address Detractors in order to resolve their concerns and improve the customer experience.


5. Advantage: Easy to Communicate

  • The NPS is an easy-to-understand metric that is well suited for communication within a company.
  • Executives, employees, and stakeholders can quickly understand the NPS and use it to make strategic decisions.


6. Advantage: Focus on Customer Feedback

  • The NPS encourages companies to regularly collect customer feedback and respond to it.
  • It promotes a customer-focused corporate culture and demonstrates that the company values customer opinions.


7. Advantage: Proactive Improvement

  • By continuously measuring the NPS, companies can proactively implement improvements and identify trends in customer satisfaction.
  • This enables companies to adapt and optimize products, services, and processes more quickly.

Improving the Net Promoter Score (NPS) requires a systematic approach and continuous improvement of the customer experience.

Here are some proven strategies for increasing your NPS:

1. Method: Analyze Feedback Thoroughly

  • Take the time to understand the comments and customer feedback that influenced the NPS.
  • Identify recurring themes and issues that may be leading to low ratings.


2. Method: Respond Quickly to Customer Feedback

  • Show your customers that their feedback matters by responding quickly to their concerns and comments.
  • Implement effective complaint management to proactively address issues and offer solutions.


3. Method: Improve the Customer Experience

  • Focus on improving the customer experience across all touchpoints, whether through customer service, product quality, or ease of use.
  • Implement employee training to foster a customer-focused culture and achieve service excellence.


4. Method: Strengthen Customer Loyalty

  • Identify your Promoters and strengthen their customer loyalty through special offers, exclusive events, or reward programs.
  • Offer incentives to your loyal customers to encourage them to actively recommend your company.


5. Method: Optimize Your Product or Service

  • Continuously improve your products or services based on customer feedback.
  • Take trends and new technologies into account to ensure that your offering meets your customers’ expectations.


6. Method: Benchmarking and Competitive Analysis

  • Regularly compare your NPS with benchmarks in your industry to understand your position and identify best practices.
  • Learn from the successes of other companies and adapt proven strategies to your specific situation.


7. Method: Communicate Your Progress

  • Let your customers know what actions you have taken based on their feedback and how these measures contribute to improving the customer experience.
  • Transparent communication about your efforts can strengthen customer trust and increase customer loyalty.


8. Method: Measure Continuously and Iterate

  • Conduct regular NPS surveys to track changes over time and ensure that your improvement measures are effective.
  • Adjust your strategy accordingly to continuously achieve positive results and increase your NPS in the long term.

The Net Promoter Score (NPS) is a proven metric for measuring customer satisfaction and customer loyalty.

It provides an at-a-glance indication of how likely your customers are to recommend your company, product, or service to others.

The calculation is carried out in four simple steps:

1. Step: Collect Data

Ask your customers the following question:

“How likely are you to recommend our company/product/service to a friend or colleague?”

Ask them to answer on a scale from 0 to 10.


2. Step: Categorize the Responses

Divide the responses into three categories:

  • Promoters (Score 9-10): Highly satisfied customers who would recommend the company.
  • Passives (Score 7-8): Satisfied, but not enthusiastic customers.
  • Detractors (Score 0-6): Dissatisfied customers who may speak negatively about the company.


3. Step: Calculate the Percentages

Calculate the percentage of responses in each category:

% Promoters = (Number of Promoters / Total Number of Responses) × 100

% Detractors = (Number of Detractors / Total Number of Responses) × 100


4. Step: Calculate the NPS

Subtract the percentage of Detractors from the percentage of Promoters:

NPS = %Promoters – %Detractors


Example Calculation:

Suppose you have received 100 responses:

  • 50 Promoters (Score 9-10)
  • 30 Passives (Score 7-8)
  • 20 Detractors (Score 0-6)


Calculate the percentages:

% Promoters = (50/100) x 100 = 50%

% Detractors = (20/100) x 100 = 20%


Calculate the NPS:

NPS = 50% – 20% = 30

The NPS in this example is 30.

A good Net Promoter Score (NPS) can vary depending on the industry and market, but some general benchmarks can be established:

1. Negative NPS (< 0)

A negative NPS indicates that there are more Detractors than Promoters. This is a warning sign and indicates that urgent improvements are necessary.

2. Neutral NPS (0 to 20)

An NPS in this range is considered average. It indicates that the company has both satisfied and dissatisfied customers. There is room for improvement to increase customer satisfaction and loyalty.

3. Good NPS (20 to 50)

An NPS in this range is considered good. It indicates that the company has more satisfied than dissatisfied customers and is on the right track to meeting customer expectations.

4. Very Good NPS (50 to 70)

An NPS in this range is considered very good. It indicates that the company has a strong base of Promoters who are likely to recommend the company and contribute to positive growth.

5. Excellent NPS (> 70)

An NPS above 70 is considered excellent. This indicates that the vast majority of customers are highly satisfied and would recommend the company. It is a sign of outstanding customer retention and loyalty.

Benchmarking the Net Promoter Score (NPS) across different industries can help companies better understand and improve their performance in terms of customer satisfaction and loyalty.

Here are some typical NPS benchmarks for different industries, based on available data and studies:

Technology and Software:

  • Average NPS: 40 – 50
  • Examples: Companies offering software solutions, cloud services, or hardware.


Retail:

  • Average NPS: 30 – 40
  • Examples: Stores that sell products directly to consumers, both online and offline.


Telecommunications:

  • Average NPS: 10 – 20
  • Examples: Mobile network providers, internet service providers, and telecommunications companies.


Banking and Financial Services

  • Average NPS: 30 – 40
  • Examples: Banks, insurance companies, credit unions, and other financial institutions.


Healthcare

  • Average NPS: 40 – 50
  • Examples: Hospitals, healthcare providers, and health insurance companies.


Travel and Hospitality

  • Average NPS: 40 – 50
  • Examples: Hotels, airlines, car rental companies, and tour operators.


Education

  • Average NPS: 40 – 50
  • Examples: Universities, continuing education institutions, and education providers.


Automotive Industry

  • Average NPS: 30 – 40
  • Examples: Automakers, car dealerships, and repair shops.


Energy and Utilities

  • Average NPS: 0 – 10
  • Examples: Electricity and gas providers, water utilities, and other utility companies.


Media and Entertainment

  • Average NPS: 30 – 40
  • Examples: Streaming services, publishers, and media companies.


Insurance

  • Average NPS: 30 – 40
  • Examples: Life insurance companies, health insurance providers, and other insurance service providers.


Important:
These benchmarks are intended as general guidelines but may vary depending on the specific market structure and individual company strategy.

Analyzing the Net Promoter Score (NPS) involves evaluating the collected data to gain insights into customer satisfaction and customer loyalty.

Here are the key steps for analyzing the NPS:

1. Step: Collecting the Data

Conduct the NPS survey by asking your customers to indicate on a scale from 0 to 10 how likely they are to recommend your company, product, or service to a friend or colleague.


2. Step: Categorizing the Responses

  • Promoters (9 – 10): Customers who rated you 9 or 10. They are highly satisfied and tend to actively recommend the company.
  • Passives (7 – 8): Customers who rated you 7 or 8. They are satisfied but not particularly enthusiastic and could easily switch to a competitor.
  • Detractors (0 – 6): Customers who gave a rating between 0 and 6. They are dissatisfied and may leave negative reviews or stop doing business with the company.


3. Step: Calculating the NPS

Subtract the percentage of Detractors from the percentage of Promoters to calculate the NPS:

NPS = % Promoters – % Detractors


4. Step: Interpreting the NPS

A high NPS (e.g., above 50) indicates strong customer satisfaction and loyalty, while a low NPS (e.g., negative or below 0) indicates that more customers are dissatisfied than satisfied.


5. Step: In-Depth Analysis

  • Root Cause Analysis: Investigate the reasons behind the ratings given by Detractors and Passives. Identify recurring complaints, problems, or weaknesses.
  • Segmentation: Segment the NPS by different customer groups, products, or regions to identify differences and develop targeted measures.
  • Long-Term Trends: Track the NPS over time to identify improvements or declines in customer satisfaction and measure the impact of initiatives to improve the customer experience.


6. Step: Deriving Actions

Based on the findings from the analysis, develop concrete action plans to improve customer satisfaction and increase the NPS.

Prioritize measures that could have a significant impact on customer satisfaction and loyalty.


7. Step: Communication and Feedback Loop

Communicate the NPS results and planned measures internally within the company to promote awareness and collaboration.

Close the feedback loop by responding to customer feedback and transparently demonstrating that you take their feedback seriously and are implementing improvements based on it.

Through thorough NPS analysis, companies can gain valuable insights to strengthen their customer relationships, improve customer satisfaction, and ultimately ensure long-term success.

An NPS survey primarily consists of the core recommendation question and can be supplemented with additional questions to gain deeper insights.

Here are some questions you can include in an NPS survey:

1. Core Question

How likely are you to recommend our company/product/service to a friend or colleague?


2. Follow-up Questions

Open Feedback:

  • What is the main reason for your rating?
  • How can we improve your experience?


3. In-Depth Questions (Optional)

  • Product Quality:
    How satisfied are you with the quality of our product/service?


  • Customer Service:
    How would you rate the customer service you received?


  • Value for Money:
    How would you rate the value for money of our product/service?


  • Ease of Use:
    How easy was it to use our product/service?


  • Repurchase Intention:
    How likely are you to purchase from us again?


  • Competitor Comparison:
    How do you compare our products/services with those of our competitors?


  • Suggestions for Improvement:
    Are there any specific features or improvements you would like to see?


By combining the core question with targeted follow-up questions, companies can not only determine their NPS but also gain valuable insights into the reasons behind the ratings and identify specific opportunities for improvement.

1. Tip: Clear and Precise Wording of the NPS Question

  • Make sure the core question is clear and easy to understand: “How likely are you to recommend our company/product/service to a friend or colleague?”
  • Avoid complex or ambiguous wording to ensure that respondents interpret the question consistently.


2. Tip: Regular and Consistent Measurement

  • Conduct NPS surveys regularly to identify trends over time and track the impact of improvement measures.
  • Take seasonal fluctuations or special events into account, as these may affect your NPS.


3. Tip: Segmentation and Analysis of Results

  • Segment your customer base to analyze NPS across different customer groups, regions, or products.
  • Identify specific areas that require improvement and prioritize measures based on the insights gained.


4. Tip: Integrating NPS into the Company

  • Make NPS an integral part of your company strategy and decision-making at all levels.
  • Regularly share NPS results with all relevant departments and foster a customer-centric culture throughout the organization.


5. Tip: Clear Action Plans and Responsibilities

  • Develop clear action plans based on the NPS results and assign responsibilities to ensure that they are implemented.
  • Set realistic goals for improving your NPS and regularly review your progress.


6. Tip: Feedback Loop and Customer Follow-Up

  • Close the feedback loop by responding to the feedback you receive and showing customers that their opinions matter.
  • Follow up on individual customer feedback to resolve specific issues and turn negative experiences into positive ones.


7. Tip: Employee Training and Empowerment

  • Train employees in customer service, communication, and conflict resolution to improve the customer experience and increase the NPS.
  • Empower employees to proactively address customer needs and submit suggestions for improvement.


8. Tip: Benchmarking and Learning from Best Practices

  • Regularly compare your NPS with industry benchmarks and learn from the proven practices of other successful companies.
  • Experiment with new approaches and technologies to continuously improve the effectiveness of your NPS strategy.

More customer survey templates

Survey-Template-Measure Customer Satisfaction

Customer Satisfaction

Survey template details

Customer Effort Score Survey Template

Customer Effort Score

Survey template details

Customer Satisfaction Score Questionnaire Template

Customer Satisfaction Score

Survey template details

Survey Template: Product satisfaction

Product Satisfaction

Survey template details

Guest satisfaction questionnaire template

Guest Satisfaction

Survey template details

Explore all survey templates  

You are in professional company

Immoscout 24 Logo
Tui Logo
Porsche Logo
Lufthansa Logo
Jaegermeister Logo

Over 740,000 participants in easyfeedback surveys every month

Result

STUDIO

The performance add-on for your analysis

easyfeedback Result Studio 2