Optimize the customer experience with the Customer Effort Score

Measure your customers' problem-solving efforts with the CES

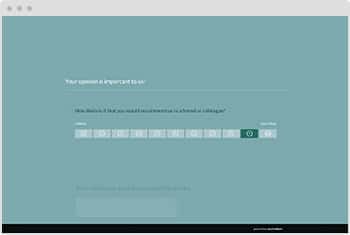
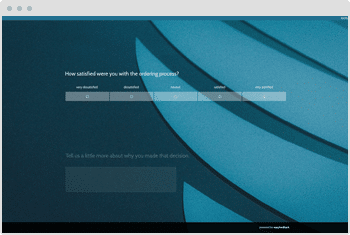
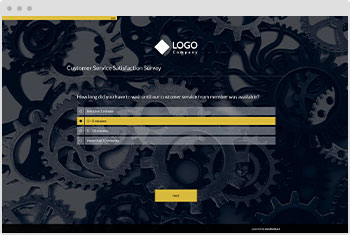
Improve the customer experience – strengthen customer loyalty – boost profitability. With easyfeedback and our ready-made CES template, you can immediately ask customers how much effort an interaction or problem resolution required from their perspective.

Immobilienscout 24 ist begeisterter easyfeedback Nutzer

“Identifying user needs is at the heart of our business. easyfeedback has been helping us with this task for several years now. We particularly appreciate its intuitive usability and professional support.”

Franziska Becker
Guild Lead User Experience Research
TUI ist begeisterter easyfeedback Nutzer

“We use easyfeedback for internal and external surveys—it’s fast, convenient, and easy! The uncomplicated and friendly support puts a smile on our faces, and we are delighted with the continuous development of the platform.”

Jennifer Fischer
Guest & Competitor Insights Analyst

Why measure satisfaction with CES?

Every company strives for satisfied customers and long-term loyalty. To achieve this, metrics are needed that continuously measure customer satisfaction and loyalty.

Metrics such as willingness to recommend or customer retention rates help in this regard.

A study by Dixon, Freeman & Roman shows that 94% of customers remain loyal to a company when the effort required to resolve issues is low. In contrast, 81% of customers consider leaving a negative review if the effort required is high.

The Customer Effort Score (CES) measures this effort with just one simple question and provides valuable insights for optimizing customer satisfaction.

Use regular CES surveys to reduce the complexity of customer interactions and improve the experience with your company.

Contents of the template:

Objectives of the survey:

Helpful features for the survey:

  • Survey options: Anonymous, partially anonymous, personalized
  • Invitation options: Link, email, QR code, and more
  • Segment analysis based on survey groups or response patterns
DSGVO-konforme Online-Umfragen

Data protection „made in Germany“ (GDPR)

Anonyme Teilnahme an Umfragen

Anonymity function for honest feedback

Frequently asked questions about CES

The CES is a metric that is measured using a specific type of question in a customer satisfaction survey.

It provides insights into how easy and effortless an interaction with your company/product was from the customer’s perspective, for example, how easy it was to find the right contact person or get answers to their questions.

Based on these insights, measures can be taken to optimize processes and reduce complexity in order to improve the user experience.

In addition, the Customer Effort Score provides insights into customer loyalty, which contributes to customer satisfaction.

In the highly competitive and rapidly growing market of every industry, it is important to measure customer loyalty in order to minimize customer churn rates.

A CES survey gives you a clear overview of how much effort a customer has to make to resolve a problem or issue, for example, with a product.

The survey reveals potential for improvement and helps you identify specific areas that require optimization.

After all, only when you know which areas are causing difficulties for your customers can you take targeted measures to improve them.

The Customer Effort Score quickly shows which areas need to be optimized in order to increase customer satisfaction.

It is particularly important to conduct continuous CES surveys.

Even in areas that have already been optimized, it is useful to determine whether the changes made have achieved the desired results or whether further adjustments are necessary.

There are many ways to measure the level of effort your customers have to make to resolve an issue after interacting with you or your product.

For example, you can use a CES survey after every email or phone interaction with your support team to find out how easy or difficult the interaction with your support was.

You can also measure your customers’ effort after they have read one of your help articles. This can help you determine how quickly your customers were able to find the answers they were looking for.

Another possible application is to ask customers how much effort they had to make to resolve a problem with your product.

As you can see, a CES survey can be used in many different scenarios.

It is particularly useful whenever you want to measure the customer experience in terms of the effort required to resolve a problem.

The CES measures the effort customers have to make to resolve an issue, for example, when contacting support or completing a purchase.

The CSAT, on the other hand, measures customers’ overall satisfaction with a product or service and assesses how well their expectations have been met.

Differences:

  • Focus: CES evaluates process efficiency, while CSAT measures satisfaction.
  • Goal: CES identifies obstacles and areas of friction, while CSAT indicates how well customer expectations are being met.
  • Use: CES is useful for process-oriented interactions, while CSAT can be used throughout the entire customer journey.

The NPS measures the likelihood that customers will recommend a company. It is considered an indicator of overall customer satisfaction and loyalty.

The CES measures how easy it was for a customer to complete a specific task or resolve a problem.

Differences:

  • Focus: CES evaluates process efficiency, while NPS measures customers’ willingness to recommend.
  • Goal: CES identifies obstacles, while NPS helps assess and improve customer satisfaction and loyalty.
  • Use: CES is useful for process-oriented interactions, while NPS is suitable for measuring overall satisfaction and loyalty throughout the entire customer lifecycle.

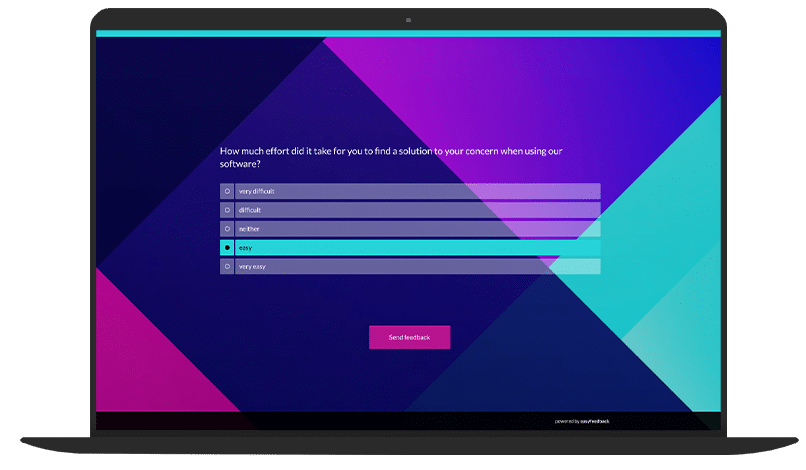
The Customer Effort Score (CES) is determined through a simple survey in which customers indicate on a scale how much effort was required for a specific interaction.

However, the exact scale and calculation method may vary slightly. Here is a common method for calculating the CES:

1. Step: Conduct a Survey with a CES Question

An example of a CES question is:

“How easy was it for you to [resolve your issue/complete a specific task]?”

Responses are measured on a scale, for example from 1 to 5 or 1 to 7.

Example of a 5-point scale:

  • 1 = Very easy
  • 2 = Easy
  • 3 = Neutral
  • 4 = Difficult
  • 5 = Very difficult


A low score indicates less effort and a more positive experience.


2. Step: Collect the Ratings

The ratings from all surveyed customers are collected to obtain an overall picture of their experiences.


3. Step: Calculate the Average

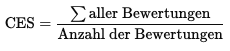
To calculate the CES, determine the average of all responses:

CES formula

Example:
If the ratings are 2, 3, 1, 2, and 4, the sum is 12. With 5 responses, the average is:

CES formula example


4. Step: Interpret the CES

The lower the CES value, the less effort customers perceived.

A value close to 1 indicates a very user-friendly experience, while higher values indicate that customers experienced difficulties.


Tips for Optimization

  • A low CES (e.g., between 1 and 2) indicates that customers found the process easy.
  • High scores (e.g., 4 or 5) indicate that customers experienced difficulties and that the process may need to be improved to reduce the effort required.

A good Customer Effort Score (CES) is generally a low value, as a low CES indicates that customers had to make less effort to resolve their issue or complete a specific task.

However, the exact interpretation depends on the scale used and the specific industry standard.

Here are some general benchmarks:

1. Scale and Interpretation

  • 5-point scale:
      • A good CES is typically 1 or 2. This means that customers found the process “very easy” or “easy.”
      • A score of 3 (neutral) is acceptable but indicates room for improvement.
      • Scores of 4 or higher (difficult) indicate that customers found the process cumbersome and that improvements may be necessary.


  • 7-point scale:
      • A good CES would typically be an average score of 2 or lower.
      • Scores of 3–4 are considered average and indicate that customers were able to complete the process, but improvements would be desirable.


2. Industry Dependence

  • In highly customer-focused industries such as retail, e-commerce, and customer service, lower CES values are typically expected because customers expect a smooth and fast interaction.
  • In more complex industries such as banking or healthcare, CES expectations may be somewhat higher because interactions tend to be more demanding. Nevertheless, the goal should also be to keep customer effort as low as possible.


3. Best Practices

  • An average score below 3 on a 5-point scale or below 4 on a 7-point scale is often considered a target, as this indicates that most customers perceive the process as requiring little effort.
  • Continuous customer feedback on specific interactions, such as support requests or the use of online services, can help reduce the CES in a targeted way and increase customer satisfaction.

Benchmarks for the Customer Effort Score (CES) vary depending on the industry, type of customer interaction, and scaling methods used.

Unlike established KPIs such as the Net Promoter Score (NPS), there are no generally applicable benchmarks for CES, as it is strongly focused on specific processes and interactions.

Nevertheless, there are guidelines and best practices that companies can use as a point of reference.

1. Industry: E-Commerce and Retail

  • Customers expect a smooth experience. A CES between 1 and 2 is ideal and indicates that processes are efficient.
  • Values around 3 are acceptable, but higher values should be avoided, as they can often lead to abandoned purchases.


2. Industry: Telecommunications and IT Services

  • These industries often involve more complex interactions, and a CES of 2 to 3 is considered acceptable.
  • Values above 3 indicate that customers are experiencing significant difficulties, which can often lead to dissatisfaction and customer churn.


3. Industry: Banking and Insurance

  • Due to the complexity of the services, a CES of 2 to 3 can be considered good in this sector.
  • Values above 3 indicate that processes may be too complicated or difficult for customers to understand.


4. Industry: Healthcare

  • Interactions in this sector can also be complex. An acceptable CES can range from 2 to 3.
  • Values above 3 indicate that patients experienced difficulties, which can negatively affect patient satisfaction.


Best Practices for CES Benchmarks

  • Compare with your own historical data:
    Since industry-specific CES benchmarks are rare, companies can best track their own CES scores over time to identify improvements or declines.


  • Segment by interaction type:
    CES can vary depending on the type of interaction (e.g., online purchase vs. customer service inquiry). Benchmarks should therefore be segmented by interaction type and channel.


  • Combine with other metrics:
    CES scores can be effectively combined with NPS or Customer Satisfaction Score (CSAT) to gain a more comprehensive view of the customer experience.


Targets for an Optimal CES

As a general guideline, companies should aim for an average CES of below 3 on a 5-point scale or below 4 on a 7-point scale.

Companies with a CES within these ranges are generally considered customer-friendly and efficient.

easyfeedback is a survey tool that helps companies collect and analyze targeted customer feedback.

For measuring the Customer Effort Score (CES), easyfeedback is particularly useful because it greatly simplifies the creation, distribution, and analysis of surveys, allowing you to gain precise insights into the customer experience.

Here are some specific benefits of easyfeedback for measuring and optimizing the CES:

1. Benefit: Easy creation of CES surveys

With easyfeedback, you can create specific CES questions to measure the effort your customers experience during individual interactions.

This is made possible through user-friendly templates and intuitive tools that speed up the survey creation process.

The platform also offers a selection of scale formats (e.g., 5-point or 7-point scales) that are suitable for measuring the CES.

This allows you to choose the scale that best fits your target audience and evaluation objectives.


2. Benefit: Personalization and segmentation

easyfeedback allows you to use individual questions and survey logic to tailor the CES question to specific interactions or customer groups.

For example, you can customize surveys for different touchpoints such as customer service, onboarding, or the checkout process.

Using segmentation options, you can target surveys to specific audiences to obtain differentiated feedback on individual interactions.


3. Benefit: Multichannel distribution

easyfeedback allows you to distribute surveys through various channels – e.g., via email, link, QR code, or directly through your website.

This enables you to measure the CES directly after a specific event and collect immediate and accurate customer feedback.

This flexibility in distribution allows you to place CES surveys exactly where customers interact with your company, helping you achieve higher participation rates and more accurate results.


4. Benefit: Automated analysis and data evaluation

easyfeedback provides comprehensive analyses and reports on survey results, helping you quickly calculate the average CES score and identify areas for improvement.

Our platform offers visual dashboards and export options for detailed data analysis.

You can identify trends and patterns across different interactions and see exactly where customers are experiencing difficulties.

easyfeedback also allows you to filter and compare results by categories such as date, customer group, or channel.

This enables you to take targeted action in specific areas where customers are experiencing a high level of effort.


5. Benefit: Integration into your processes and CRM tools

Our survey tool can be integrated with various CRM and support tools, making it particularly useful for seamlessly incorporating CES surveys into existing customer support and feedback processes.

Through the integration, you can link feedback directly to customer data and automate actions based on CES results, such as follow-ups for high CES scores to resolve issues quickly.


6. Benefit: Turning results into actionable improvements

With the insights from easyfeedback, you can specifically identify areas where customer effort is too high and proactively improve them.

By conducting regular CES surveys and using easyfeedback’s analysis features (including AI-based tools), you can track the impact of your optimizations and ensure that customer effort is continuously reduced.

Yes, there are. Below, we have compiled four tips for using the Customer Effort Score effectively:

Tip 1: Survey customers immediately after the interaction

The sooner you ask customers about the complexity of an interaction, the fresher their memory will be and the more valuable the customer feedback will be.

If you wait too long, not only can the quality of the feedback suffer, but customers may also be less willing to participate in the effort survey.


Tip 2: Use it regularly

To use the CES to determine customer satisfaction and the effort required after each interaction with your company or product, you need to conduct the CES survey regularly and over a longer period of time.

Only then can you identify whether your customers had a positive or negative experience with the interaction options you provide, such as contacting your support team or reading your help articles.


Tip 3: Do not use a welcome page

Start your CES survey directly with the question about the effort required for the interaction.

A welcome page containing text and additional information can already lead to dropouts, as participants may assume that the survey will be lengthy.

Ultimately, however, participants only need to answer one question or, optionally, a few questions.


Tip 4: Respond to the feedback

Once you have collected enough feedback on one of your interactions, you should respond to it depending on whether the feedback is positive or negative.

Nothing is worse than leaving feedback unused and failing to make improvements.

More customer survey templates

Survey Template NPS

Net Promoter Score

Survey template details

Customer Satisfaction Score Questionnaire Template

Customer Satisfaction Score

Survey template details

Survey Template: Customer care and Support Feedback

Support & Service Feedback

Survey template details

Survey-Template-Measure Customer Satisfaction

Customer Satisfaction

Survey template details

Customer analysis questionnaire template

Customer Analysis

Survey template details

Explore all survey templates  

You are in professional company

Immoscout 24 Logo
Tui Logo
Porsche Logo
Lufthansa Logo
Jaegermeister Logo

Over 740,000 participants in easyfeedback surveys every month

Result

STUDIO

The performance add-on for your analysis

easyfeedback Result Studio 2