You have completed your survey, invited your participants and now the first results are coming back. Here we show you how you can evaluate your results with easyfeedback and gain into the important insights:
The statistics
As soon as you open the evaluation for your survey, you will get to the statistics. Here you get an overview of the response rate and the behavior of the participants.
• Basic data
In the upper part you will see basic information about your survey: start and end date, participation time, length (questions) and languages of the survey.

• Visitor sources & participation behavior
Below you get an insight into participation statistics per visitor source: invitations > resulting visitors > resulting participants and these divided into participated to the end and dropped out.
This gives you a first insight into the participation behavior.

• Used End device
Via the table on the used end devices, you can see the participation behavior broken down by end device: desktop, tablet, smartphone or other if no assignment could be made.
In this view, only the device category is displayed and no manufacturer or similar.

• Participation over time
The participation history allows you to see how many people participated on the respective days – divided into participated until the end and aborted.
Tip:
If you move the mouse pointer over a section of the chart, you can take a closer look at this section.

• Jump history
The jump history is very interesting. Because here you can see on which side the participants left the survey. The biggest swing should be seen on the closing page (right) – participated until the end.
If people have dropped out of the survey before, it is worth taking a look at the question pages/questions to see if they are easy or understandable to answer.

The results
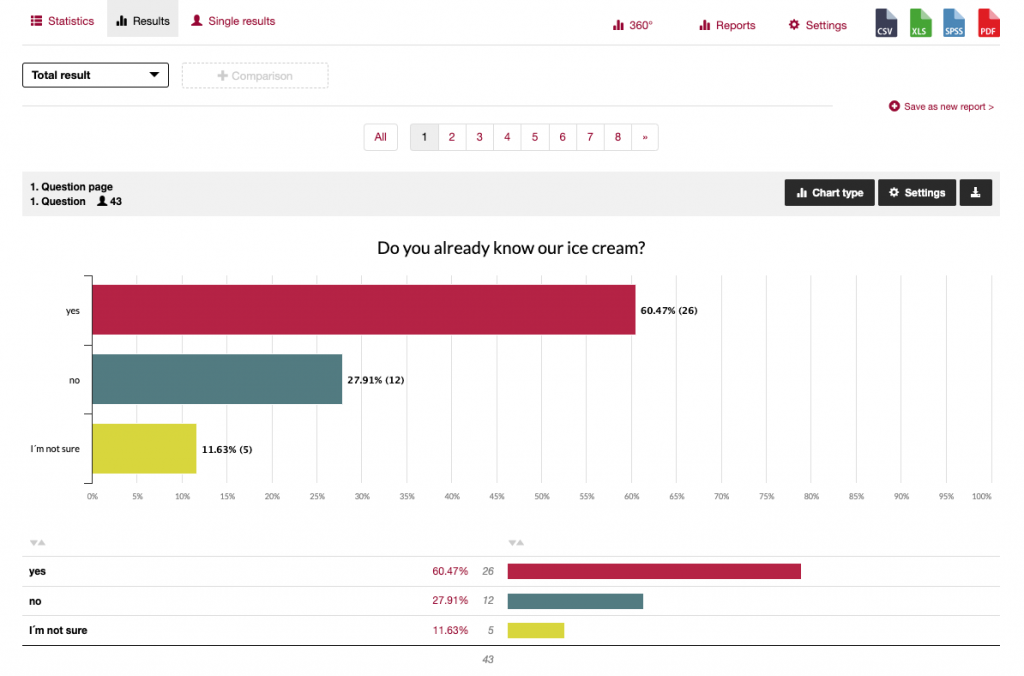
When you open the results, you will see the answers visually as well as the individual text answers to your questions.
• Overall result
As soon as you open the results for the first time or have not set a result filter, you will always see the overall result of the survey and can view the answers via the page navigation (question pages in the survey).
• Result filter
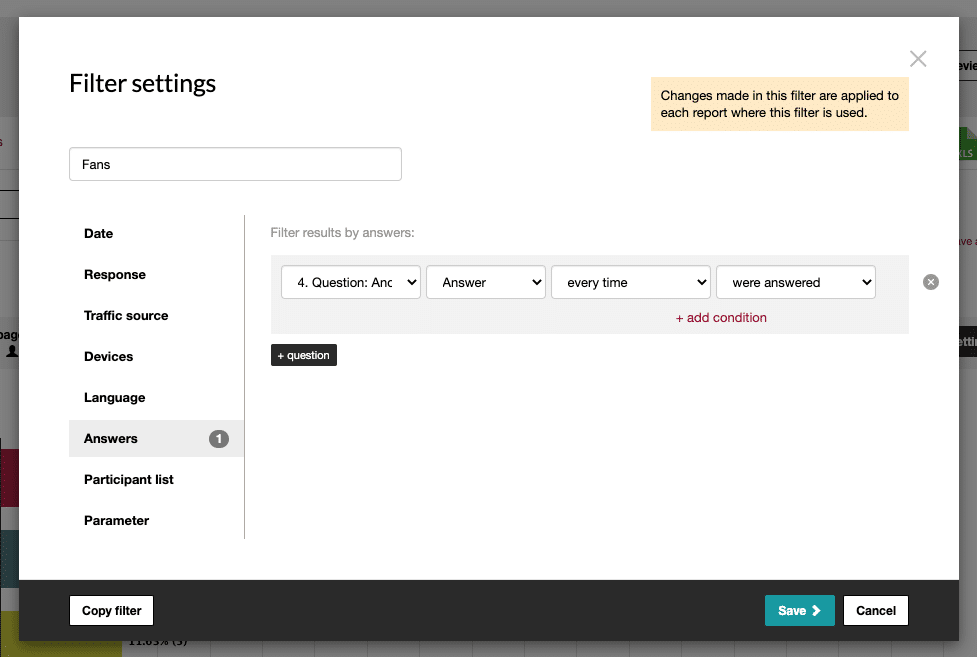
To segment the results by participant groups, you can create and save result filters. This helps you to get a deeper insight into individual participants or to gain more detailed information based on the response behavior (Video: Interpretation of survey results).
As a filter criterion, you can select any question or answer, time period, language, end device, visitor source, participant list or parameter. Simply combine the individual options to segment the desired target group.
• OneClick filter
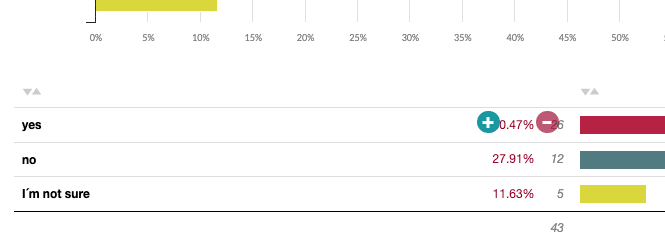
As a quick variant to the filter settings, you can also simply click on the percentage values in the data tables – below the charts. This way you can filter a result range in no time and quickly gain deeper insights.
• Settings per question
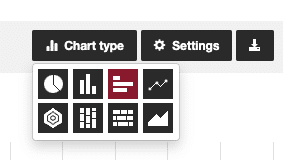
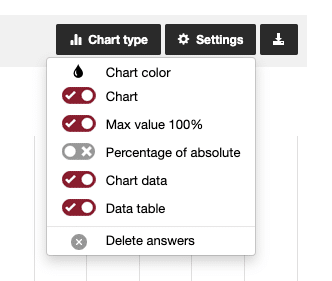
For each displayed question you get further options. With these you can configure how the diagram is displayed: Chart type, colors, percentage/absolute, maximum value, data in the chart. Just try out which setting presents your result best.
• Comparisons
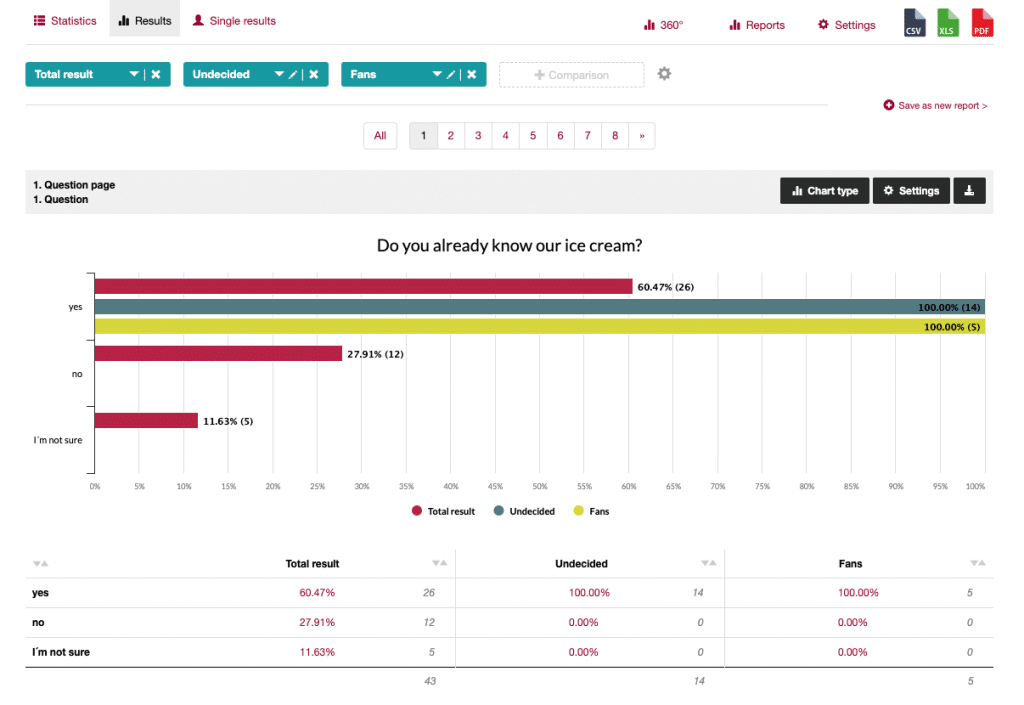
To compare two or more segmented groups of participants, simply use the comparison filter function. To do this, it is best to create one or more filters in advance and place them next to each other. With the percentage deviation and comparison you can make differences directly recognizable.
• Text answers as plain text
Within the charts you can see the number of selected answers or how many have answered to a text field. To make the text answers visible, simply click on Answers in the data table below. Here you will see the answers listed in plain text.

• Text answers as word cloud
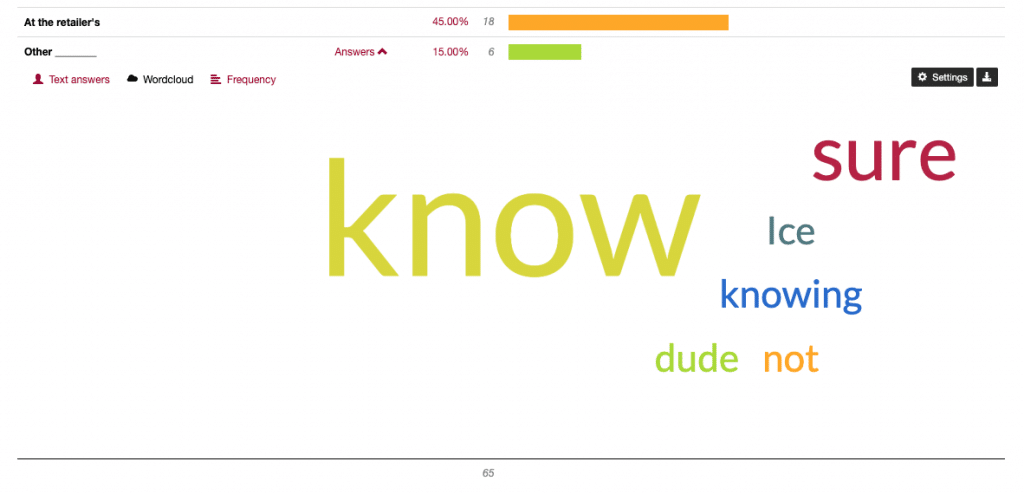
And to visually display the most common words, simply click Word Cloud next to the text responses. A distribution of the most frequently mentioned words will then be displayed. With the corresponding settings you can specify the words that should be displayed.
• Save result display as report
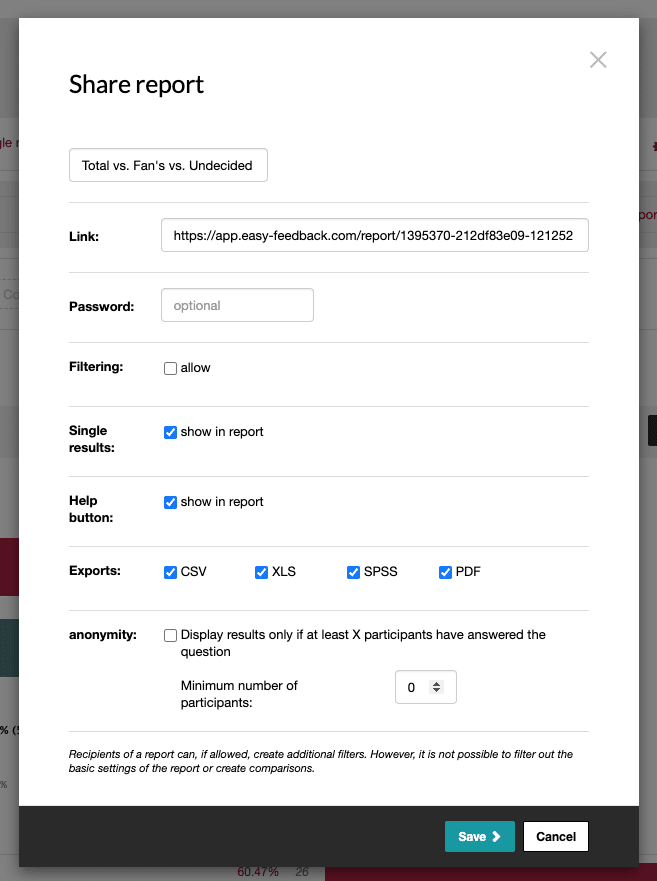
You can save each result display you have set up as a report and call it up again later. In addition, you can share created reports via link and still restrict access to the data. For example, whether the recipient is allowed to export the data or how far the person should be allowed to view the data – completely or only superficially.
The individual results
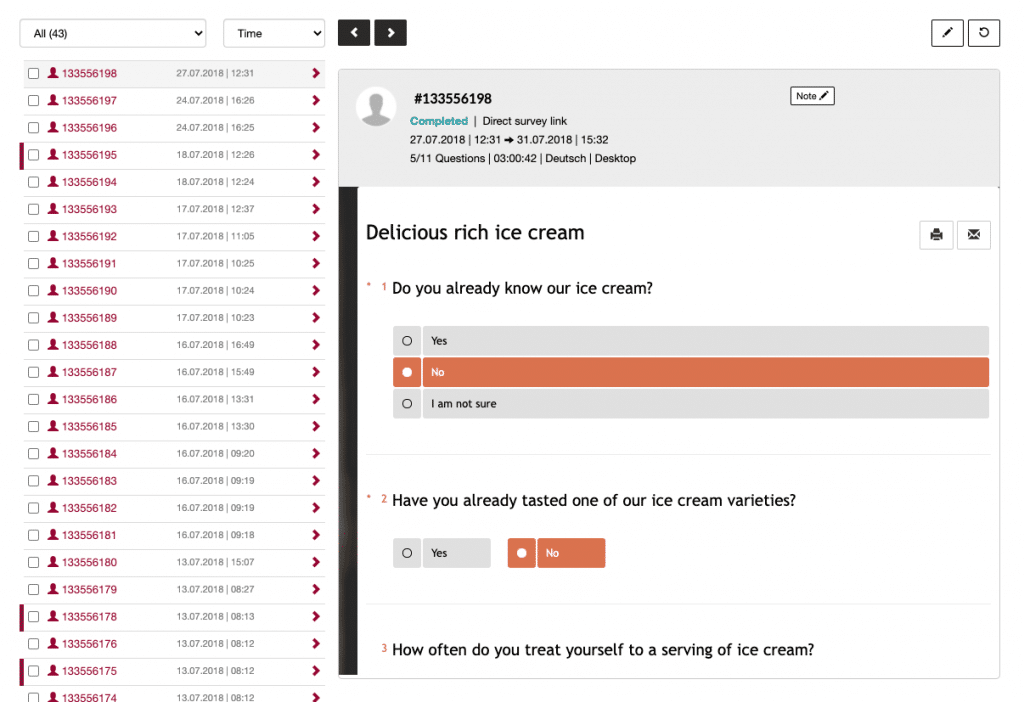
In the area of the individual results each participation is listed individually. Here you have the possibility to view the answers of each participant completely and in summary. In addition, you can release the participation again from here or edit the results if a correction is necessary.
And if you want to delete individual participants – for example, test data – you can also do this here.
The export
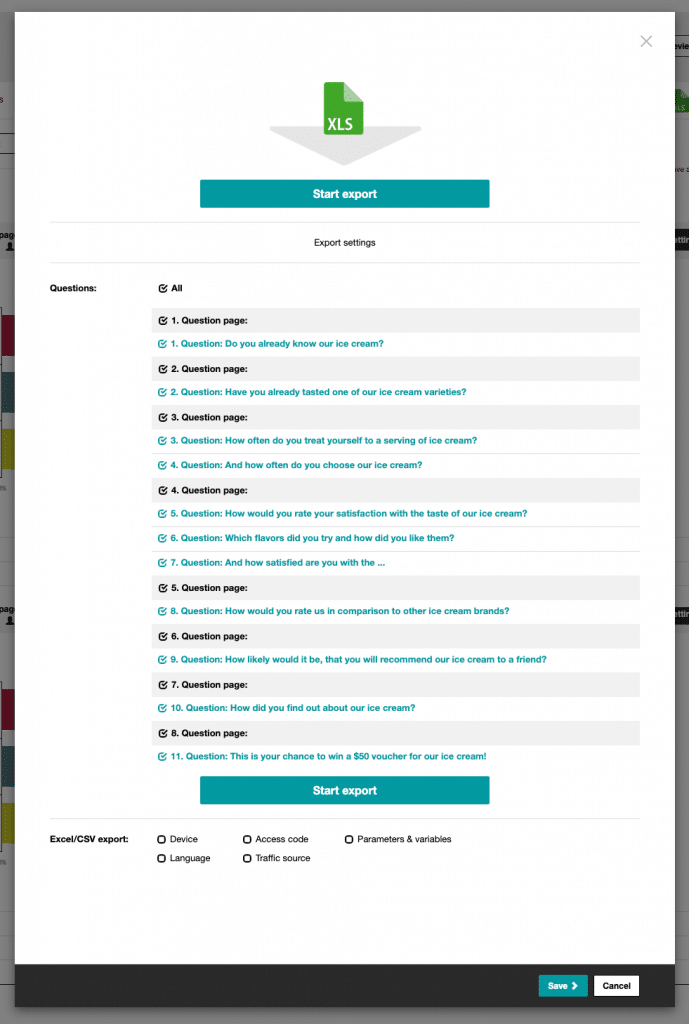
On the tab Results you are offered the export of the result data. Simply click on the desired format and export the results. You can export all or only selected questions or enrich the export with additional participant data – such as the end device, language, visitor source, parameters from the survey link or access codes used.
Tip:
The export always includes only the data that you have previously activated via the filter setting. This means that if you only view a partial result, only this result will be exported. Or if you have created a comparison, you will also only receive the comparative data in the export.
