

“Identifying user needs is at the heart of our business. easyfeedback has been helping us with this task for several years now. We particularly appreciate its intuitive usability and professional support.”

“We use easyfeedback for internal and external surveys—it’s fast, convenient, and easy! The uncomplicated and friendly support puts a smile on our faces, and we are delighted with the continuous development of the platform.”
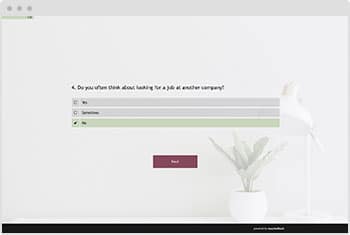
Preparing a process assessment through an employee survey is a simple and effective way to make the analysis process efficient and goal-oriented for everyone involved.
Participants can take their time to reflect on existing processes, bottlenecks, weaknesses, and opportunities for improvement, and articulate these in a structured manner.
At the same time, process owners gain an early overview of critical issues and can prepare specifically for improvement measures.
This makes the exchange more structured, focuses on the most important points, and ensures that no potential for optimization is overlooked.
A standardized survey saves time and demonstrates that the opinions of employees or stakeholders are valued.
Typical content includes feedback on processes, bottlenecks, suggestions for improvement, and innovative ideas.
Use our template to evaluate your processes in a targeted manner and continuously improve them!
Contents of the template:
Objectives of the survey:
Helpful features for the survey:

Data protection „made in Germany“ (GDPR)

Anonymity function for honest feedback
A process analysis is the systematic and structured examination of workflows, business processes or operational activities within a company or organization.
It is used to capture, document and critically evaluate individual steps of a process.
The goal is to create transparency about the process flow and determine how efficiently, economically and error-free a process actually operates.
At the center of process analysis is the question of how a process currently works (current state) and how it can be improved (target state).
For this purpose, all involved activities, people, resources, information, as well as time and costs are analyzed.
Processes are often represented graphically, for example through flowcharts, process diagrams or BPMN models. These visualizations help to better understand complex workflows and identify weaknesses more easily.
An important part of process analysis is identifying problems.
These may include unnecessary waiting times, duplicate work steps, lengthy decision-making processes, media disruptions, sources of errors or poor communication between departments.
Such weaknesses can reduce productivity, increase costs or negatively affect the quality of results.
Through analysis, these issues can be specifically identified and subsequently improved or eliminated.
The objectives of process analysis are diverse.
They range from reducing processing times and lowering costs to improving the quality of products or services.
In addition, it helps to increase customer satisfaction and secure a company’s competitiveness.
In many cases, process analysis provides the foundation for further measures such as process optimization, automation or digitalization.
A practical example is the ordering process within a company.
If an order takes too long to complete, a process analysis can reveal that multiple approval steps or manual data entries are slowing down the workflow.
By introducing digital systems or reducing intermediate steps, the process can be significantly accelerated.
In summary, process analysis is an important tool in process management.
It helps companies better understand their workflows, identify weaknesses and implement targeted improvements in order to work more efficiently and successfully in the long term.
1. Goal: Increasing Efficiency
2. Goal: Cost Reduction
3. Goal: Quality Improvement
4. Goal: Creating Transparency
5. Goal: Foundation for Process Optimization and Digitalization
6. Goal: Risk Minimization
7. Goal: Improving Communication
1. Advantage: Increased Efficiency
2. Advantage: Cost Reduction
3. Advantage: Quality Improvement
4. Advantage: Transparency & Control
5. Advantage: Foundation for Digitalization
6. Advantage: Improved Communication
7. Advantage: Risk Minimization
1. Type: Strategic Process Analysis
2. Type: Operational Process Analysis
3. Type: Quantitative Process Analysis
4. Type: Qualitative Process Analysis
5. Type: Value-Oriented Process Analysis
1. Step: Goal Setting & Planning
Clarify questions:
Define the scope of the process:
Resource planning:
Example:
2. Step: Current-State Analysis (Data and Information Collection)
Methods:
Goal:
Result:
3. Step: Process Visualization
Visualization:
Purpose:
4. Step: Process Evaluation
Analysis:
Tools:
5. Step: Target Concept / Improvement Suggestions
Goals:
Examples:
6. Step: Implementation & Monitoring
Pilot projects:
Control:
Adjustment:
7. Step: Documentation & Communication
Result documentation:
Communication:
Goal:
1. Phase: Goal Definition & Planning
2. Phase: Current-State Recording / Current-State Analysis
3. Phase: Process Visualization
4. Phase: Process Evaluation / Analysis
5. Phase: Target Concept / Optimization
6. Phase: Implementation & Monitoring
7. Phase: Documentation & Communication
1. Method: Qualitative Instruments
Interviews
Workshops
Observation / Gemba Walk
Document Analysis
Surveys / Questionnaires
2. Method: Graphical Visualization Tools
Flowchart
BPMN (Business Process Model and Notation)
Swimlane Diagram
Value Stream Mapping
3. Method: Quantitative Analysis Tools
Key Performance Indicator (KPI) Analysis
Time Measurement / Time Studies
Process Cost Accounting
Statistical Tools
4. Method: Root Cause Analysis
Ishikawa Diagram (Fishbone Diagram)
FMEA (Failure Mode and Effects Analysis)
5. Method: Digital Instruments
Process Mining
Workflow Management Systems
1. Efficiency Metrics
Lead Time
Cycle Time
On-Time Delivery / Schedule Adherence
Process Speed
2. Quality Metrics
Error Rate / Rework Rate
First Pass Yield (FPY)
Customer Satisfaction / Service Level
Compliance Rate
3. Cost Metrics
Process Costs / Cost per Unit
Costs for Rework or Errors
Resource Utilization
4. Additional Metrics
Throughput / Output
Waiting Times / Idle Times
Interface Problems
Cancellation Rate / Drop Rate
1. Category: General Information
2. Category: Process Understanding
3. Category: Efficiency and Effort
4. Category: Quality and Errors
5. Category: Improvement Potential
6. Category: Process Evaluation
7. Category: Additional Comments